2-10: Portfolio optimization and the efficient frontier
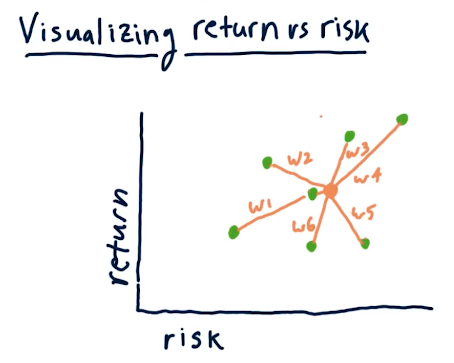
Visualizing return vs risk
In the below slide, the professor describes how we can plot risk and return for individual stocks before allocating funds to each within our portfolio. What we can do is set the allocation for each stock differently, and find a risk/return location on a scatterplot that we're comfortable with maintaining. This is visualized in the below lecture slide:
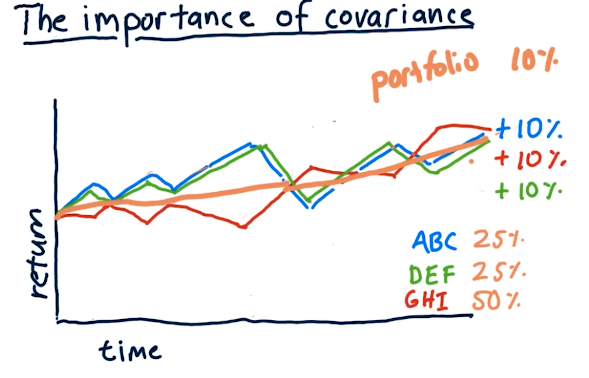
Covariance
This part of the lecture essentially covers maximizing risk while minimizing reward. In the example provided below, we allocate funds in our portfolio to securities with negative covariance, meaning when one stock goes up, the other goes down.
All of the stocks have similar returns, however, our overall portfolio encounters less risk because of the negative covariance.
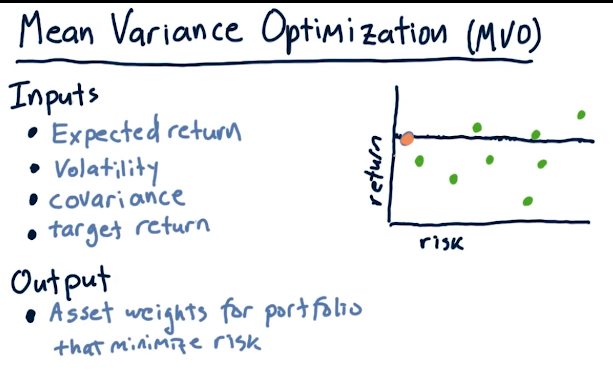
Mean Variance Optimization (MVO)
Mean Variance Optimization (MVO) is an algorithm that takes the following inputs to determine a portfolio allocation that exposes the portfolio to the least amount of risk possible and the most returns:
- expected return
- volatility
- covariance
- target return
Below is a high level overview provided by the lecture:
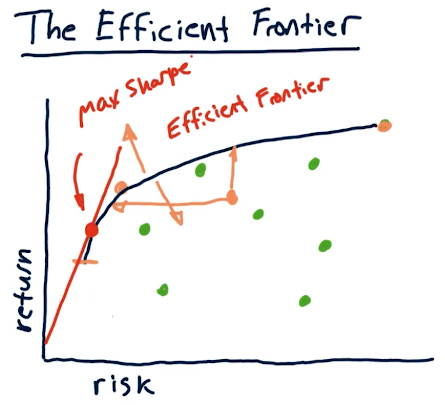
The efficient frontier
The efficient frontier is a line on our scatter plot of risk/reward security allocations - somewhere in here is a portfolio allocation for us that achieves our risk/reward tolerance. This line, the efficient frontier, is a range of optimal allocations of securities to achieve x amount of risk and y amount of return. On this line also exists a portfolio that achieves max sharpe ratio. A high level overview from the lectures is provided below: