1-1: Reading and plotting stock data
This lesson contains a basic introduction to the manipulation of data using
Python. Most of the data provided in this course comes in the format of .csv
files.
What does real stock data look like?
Usually, each .csv file containing stock data is named after its respective
stock symbol. We can expect the following headers in the stock's .csv file:
- Date
- Open
- High
- Low
- Close
- Volume
- Adjusted Close (Adj Close)
Each .csv file is sorted from newest to oldest record, based upon the Date
field.
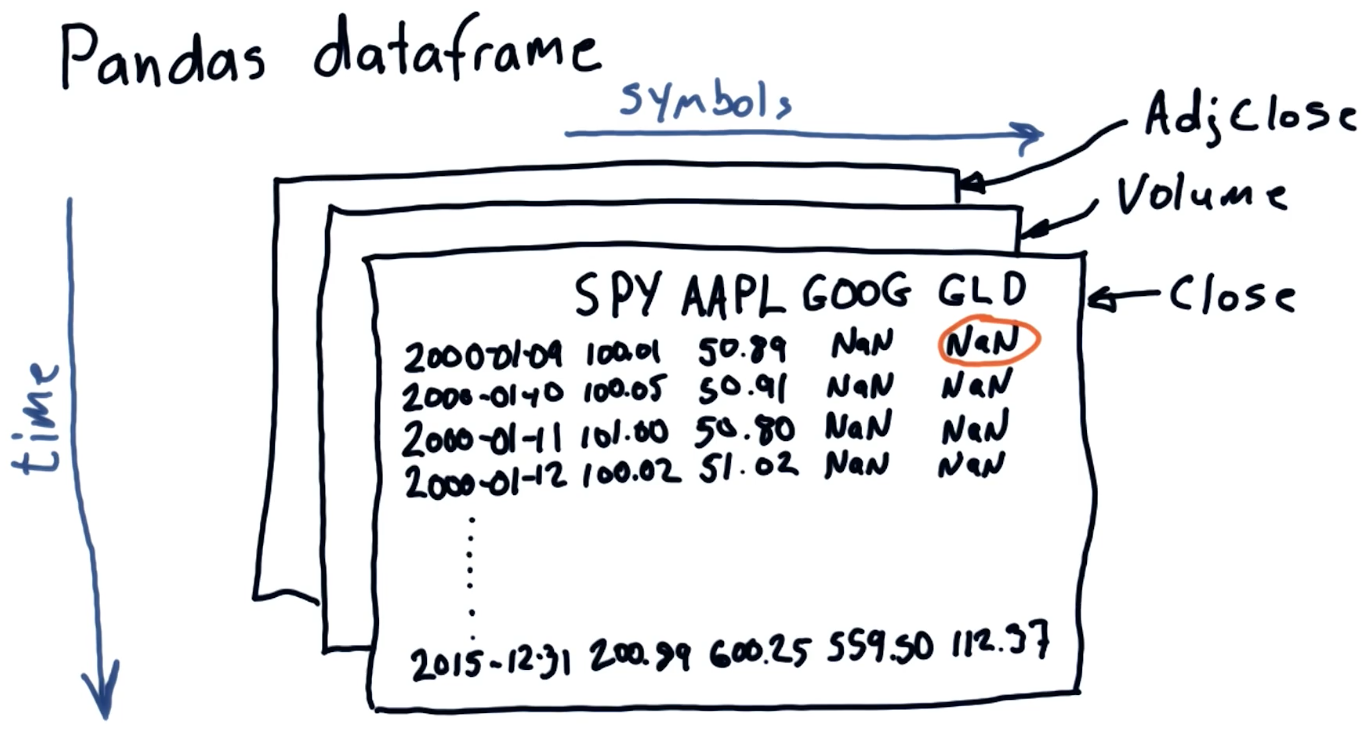
The pandas dataframe
pandas is a Python library used to manipulate large sets of data. When
pandas ingests .csv, it stores the rows and columns in a certain format, or
dataframe, that allows us to easily access different sets of data
programmatically. Below is an example drawing from the class of the Pandas
dataframe, each plane of the dataframe is separated by the headers we listed
above: Close, Volume, Adj Close, etc.
Quizzes
Which fields would you expect to see in a .csv file of stock data?
- Number of employees
- Date / time
- Company name
- Price of the stock
- Company's hometown