1-7: Sharpe ratio and other portfolio statistics
In this lesson we cover portfolio statistics used in the real world and how to calculate and interpret these statistics using Python.
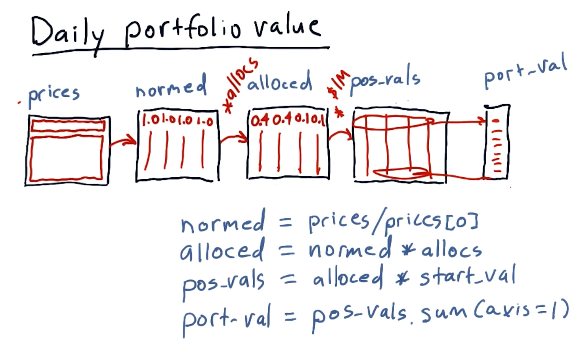
Daily portfolio values
Given a starting investment amount, allocation percentages to respective stocks, and a window in time to conduct calculations, we can calculate the daily value of a portfolio over a given period of time.
Taking the prices dataframe, we can normalize the data and apply a series of
transforms to arrive at an array of values describing our portfolio's daily
value over a given period of time. Below is a high-level interpretation of how
to achieve this outcome given a dataframe:
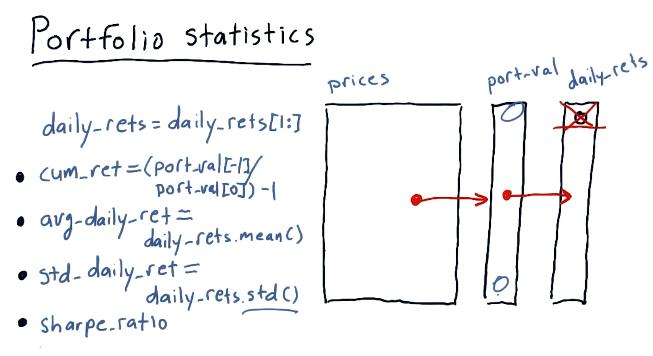
Portfolio statistics
Using our new portfolio value array, we can calculate a series of important statistics, such as:
- cumulative return
- average daily return
- standard daily return
- sharpe ratio
A high-level interpretation from the lecture is provided below. This image also provides the equations to derive the statistics listed above:
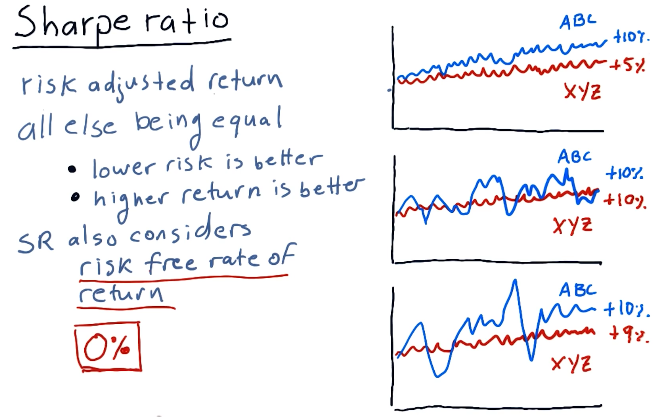
Sharpe ratio
The sharpe ratio of a portfolio is a statistic that adjusts overall return for risk apparent in the portfolio. This is mostly useful when comparing two stocks or portfolio wherein one has a greater return but poses a greater risk - it allows us to make an informed decision about the riskier of the two stocks.
A high-level representation of these concepts from the lectures is provided below:
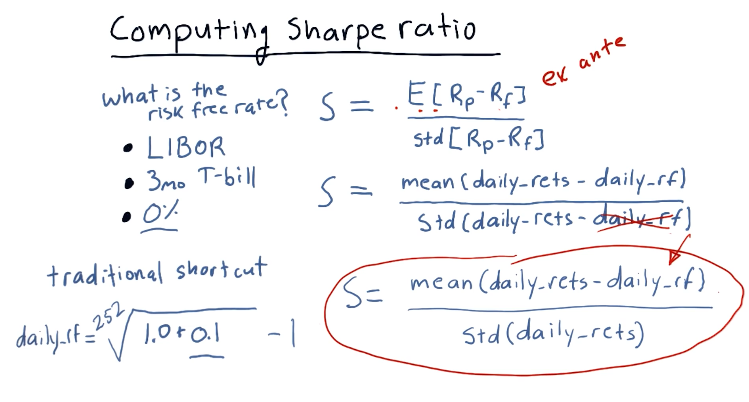
Computing sharpe ratio
To compute the sharpe ratio we need to divide the Expected Value of the
portfolio returns minus the risk free rate by the standard deviation of the
portfolio returns minus the risk free rate. The slide from the lectures, below,
provides possible references for the risk free rate, however, traditionally it's
been 0.
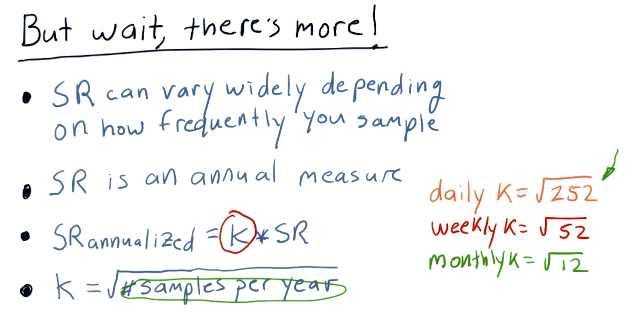
Sharpe ratio frequency
The sharpe ratio can be affected by the frequency in which sampling of the
portfolio occurs - it was originally intended to be an annual measure. In order
to acquire the annualized version of the sharpe ratio, you multiply the
sharpe ratio result by the constant k. This is calculated by taking the
square root of the frequency of sampling. The slide from the lecture provides
more insight into how the sharpe ratio is affected by frequency:
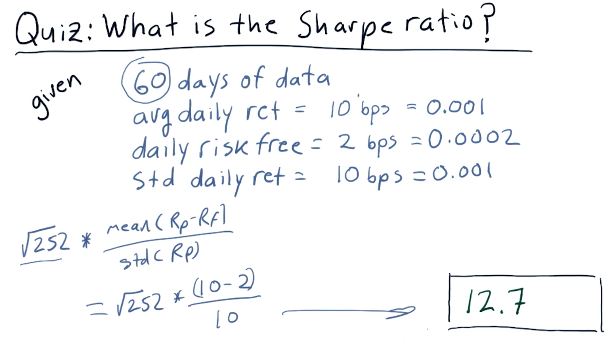
Quizzes
What is the sharpe ratio?
Below is a quiz from the class providing us with a scenario to calculate the sharp ratio with concrete values: