1-6: Histograms and scatter plots
This lesson covers how to utilize histograms and scatter plots to analyze and compare daily returns of multiple stocks. This is a more useful technique than analyzing a stock by itself.
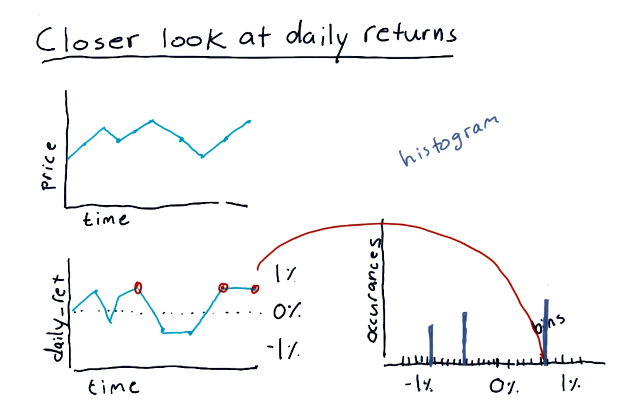
Daily returns
This section discusses what a histogram looks like and what information it captures. A high-level representation of a histogram in comparison with a stock price and daily returns graph can be found below:
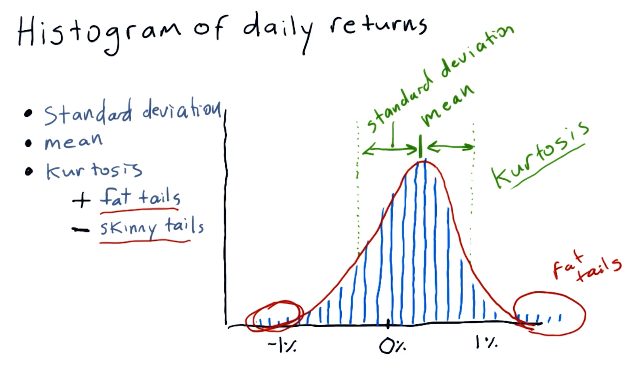
Histogram of daily returns
In the below example, the lecture discusses the normal shape of a histogram which, like most things, is a bell curve. The lecture discusses the concept of kurtosis, describing fat tails and skinny tails - a measurement of the distribution of the histogram.
Fat tails mean that there are a large number of occurrences happening on the outer edges of the distribution, meanwhile skinny tails indicate the opposite. Below is a high-level representation of these concepts:
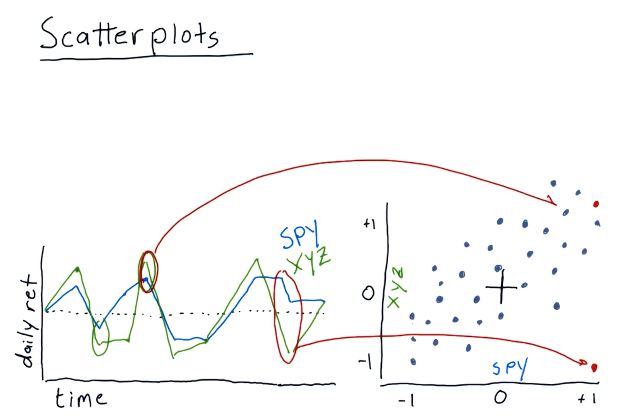
Scatterplots
This section discusses how scatterplots are generated to compare two stocks. As we can see, general trends begin to form when a scatterplot is generated for two stocks, allowing us to infer about the behavior or performance for a particular stock. Below is a high-level representation provided by the lecture:
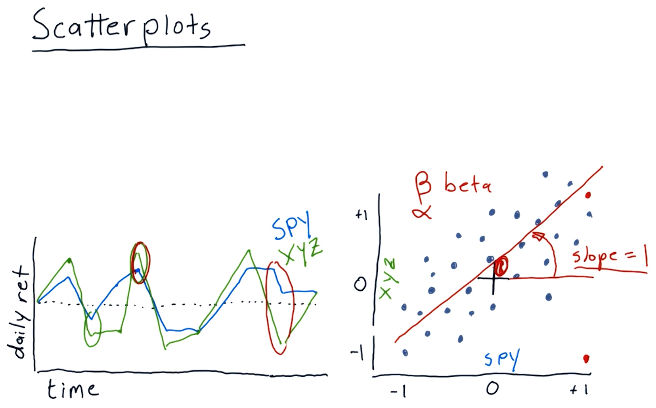
Scatterplot slopes
In this section of the lecture, alpha and beta are described for a given scatterplot. alpha and beta are both functions of the slopes of the possible lines that can be drawn for a given scatterplot. Beta describes how reactive a particular stock is to the market. If the market goes up by %1, this stock would also achieve %1 - if the beta was equal to one. If the beta was equal to two, the stock would achieve %2 while the market achieved %1.
In a similar vein, we have alpha - the intersection between the line we've drawn using the scatterplot and the vertical axis. alpha describes how a stock performs on average better than market making stocks like the S&P500.
A high-level representation of these concepts is provided below:
Correlation
Correlation is a measurement of how close the dots on a scatterplot are to the line we've drawn through the scatterplot.