1-4: Statistical analysis of time series
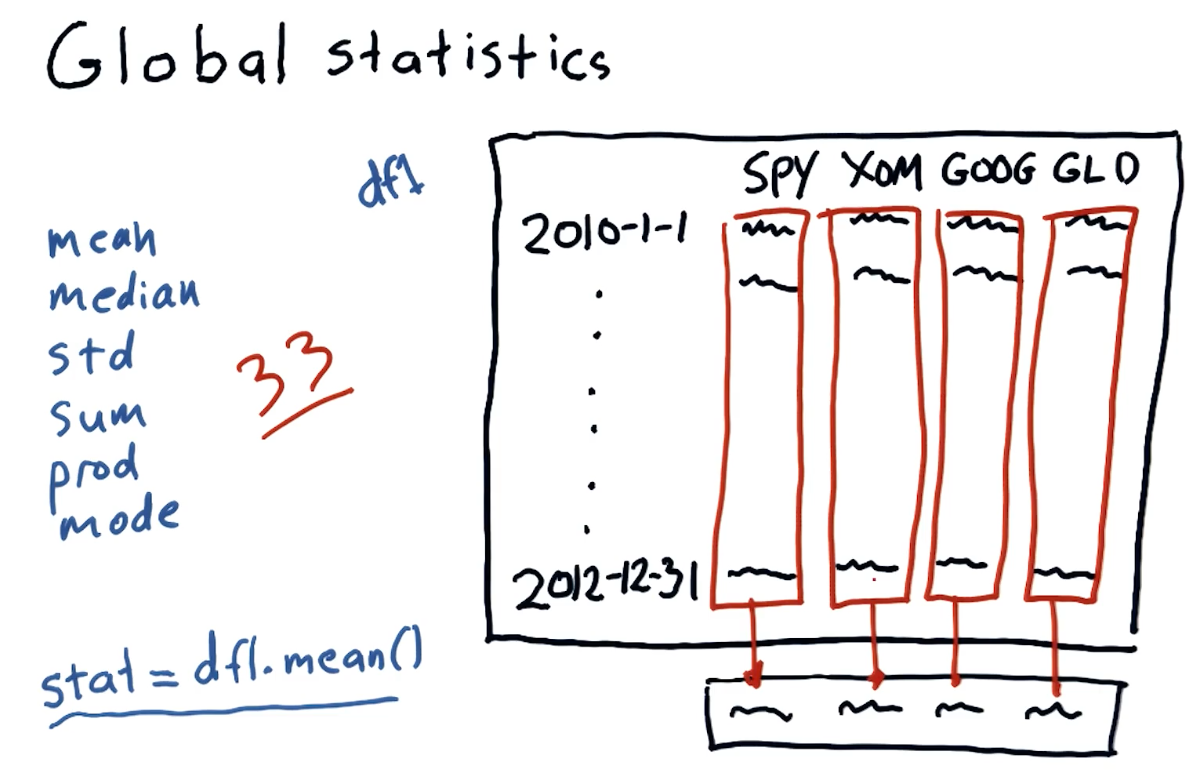
Global statistics
We can easily compute global statistics like mean, median,
standard deviation, and more using pandas dataframes. A high-level
interpretation provided in the course lecture is provided below:
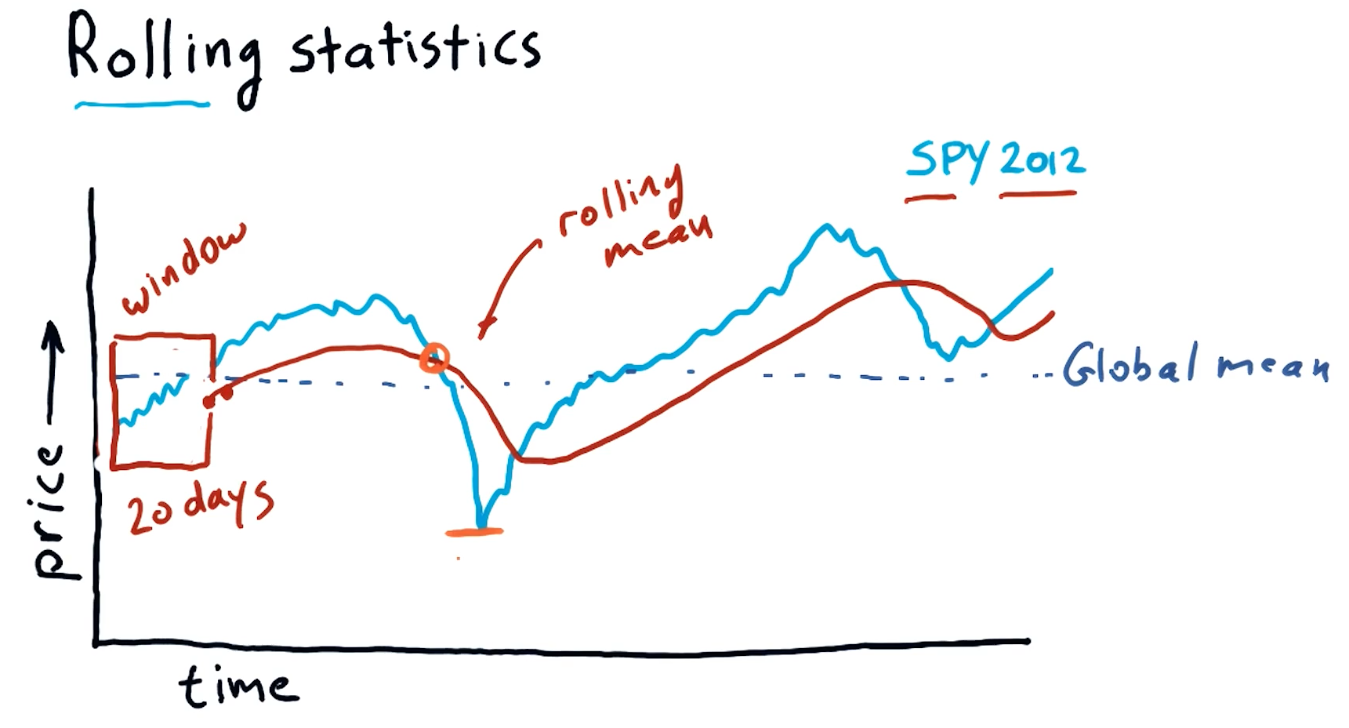
Rolling statistics
Rolling statistics are statistics observed during a time-slice of the global data. These rolling statistics allow us to derive trends from the global data. A high-level interpretation provided in the course lecture is provided below:
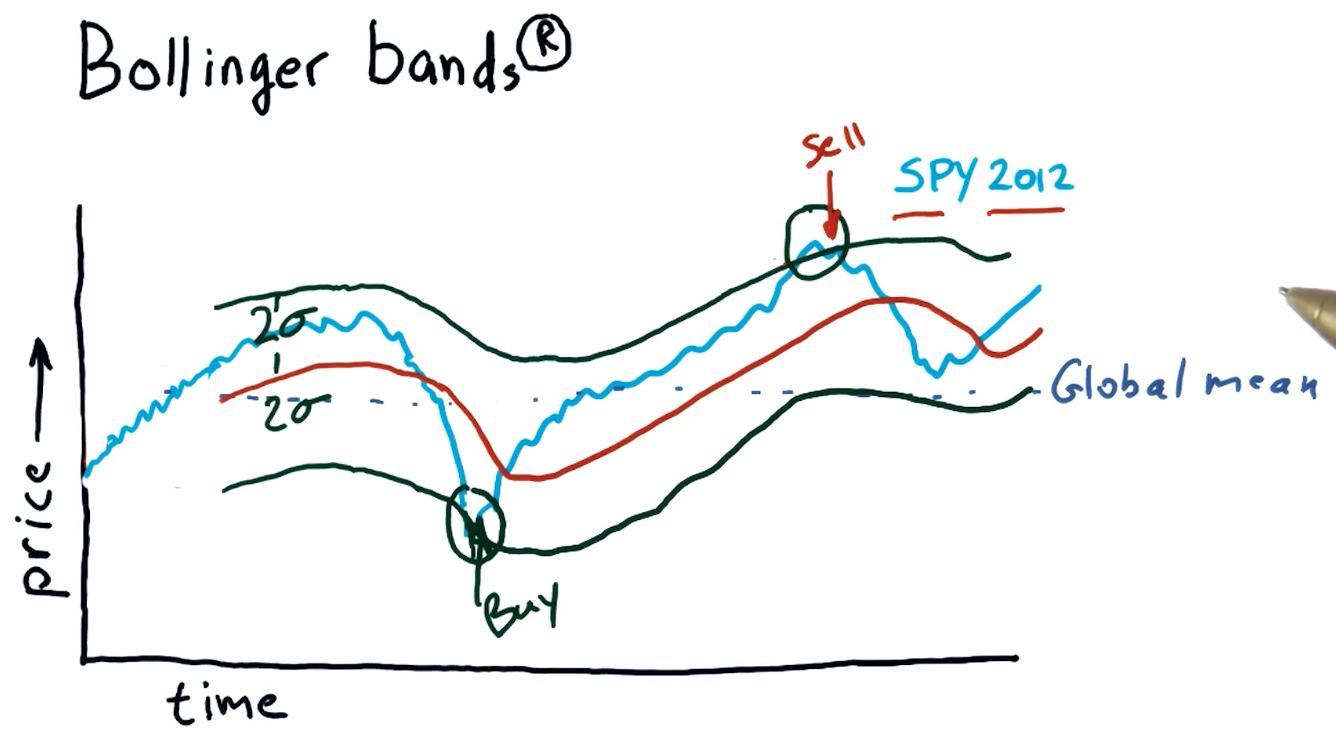
Bollinger bands
Bollinger bands are a trading concept where we maintain a rolling mean and define two bands that are separated two standard deviations from the rolling mean in both directions. Once a stock's value crosses below the lower threshold and then crosses above it, we can consider this a buy signal. Similarly, we can detect a sell signal when a stock crosses above the higher threshold and begins to dip below it. A high-level interpretation provided in the course lecture is provided below:
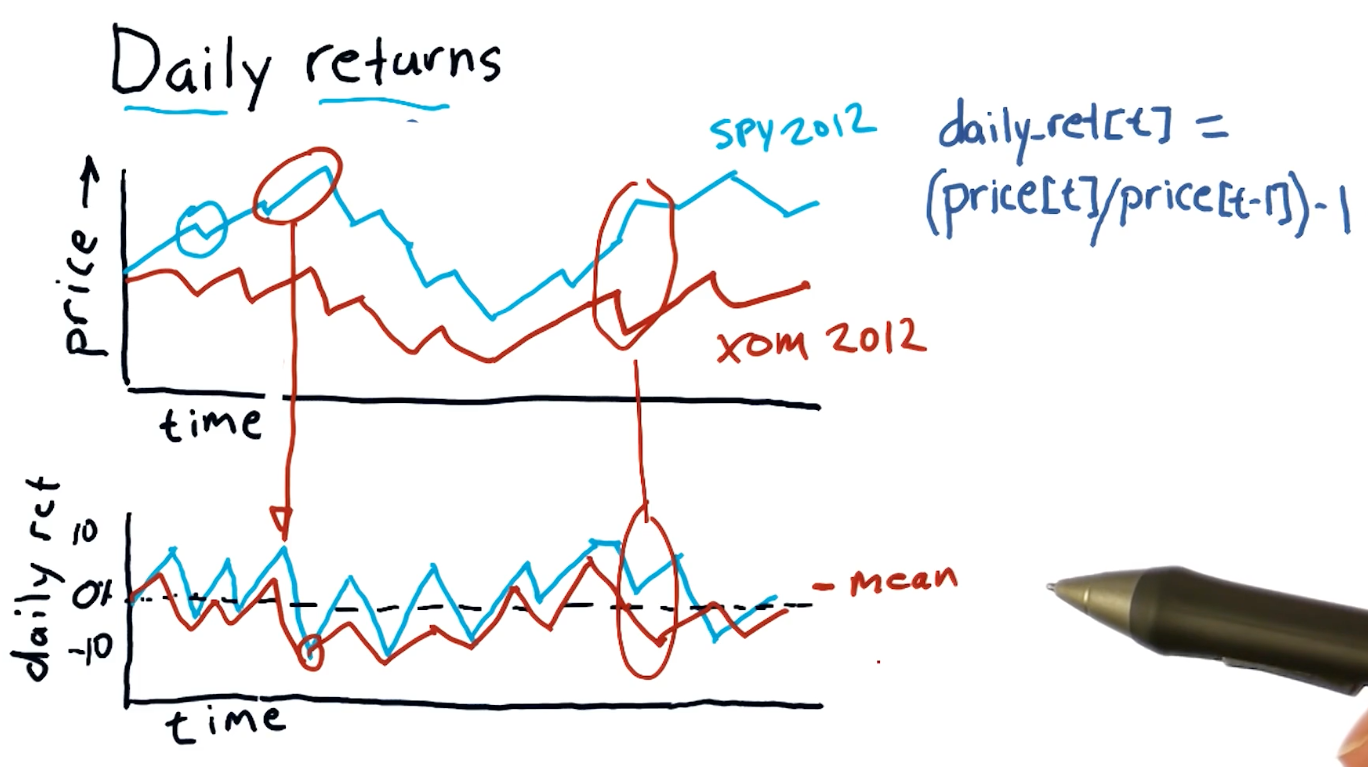
Daily returns
Daily returns can be easily calculated using the following equation:
daily_ret(t) = (price[t] / price[t-1]) - 1
Where t == date.
A high-level representation of daily returns from the course lecture is provided below:
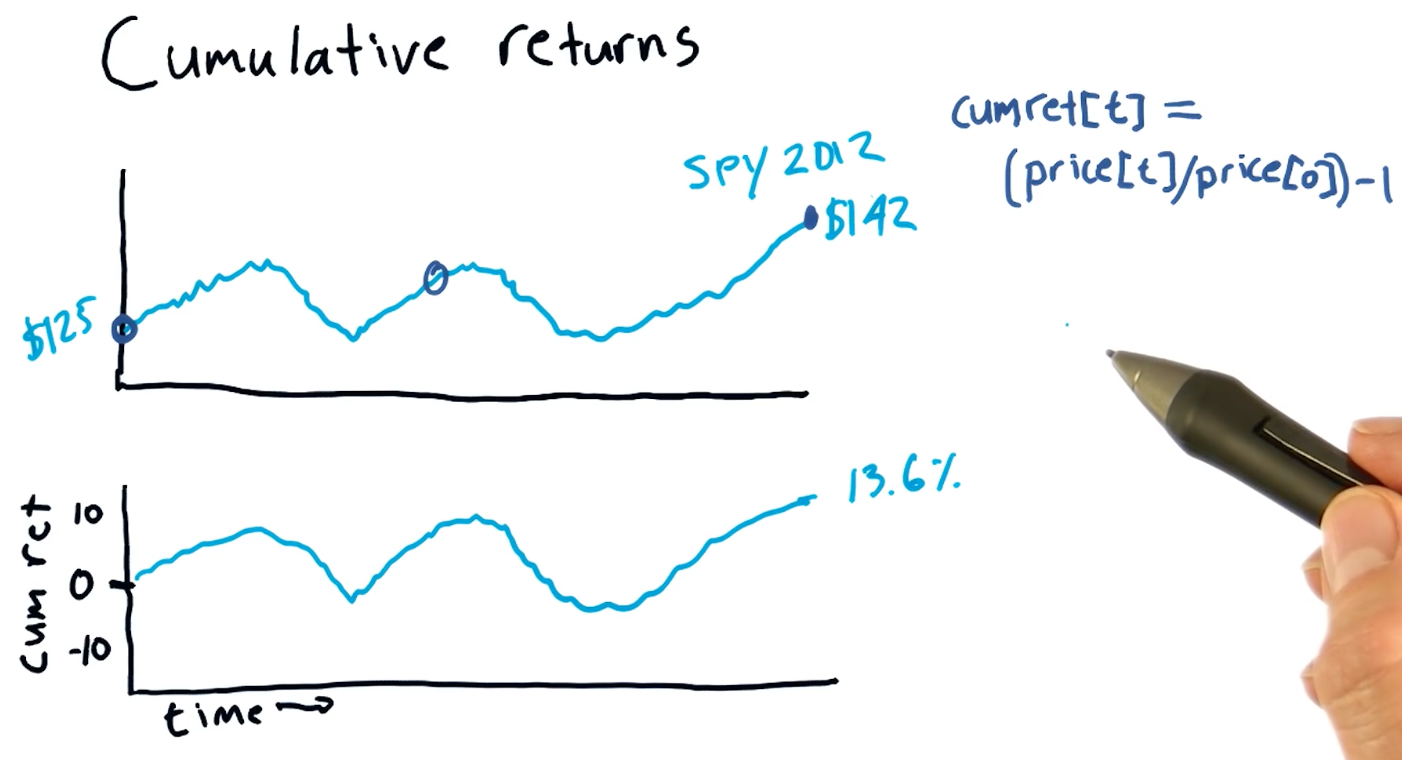
Cumulative returns
Cumulative returns can be easily calculated using the following equation:
cumulative_ret(t) = (price[t] / price[0]) - 1
A high-level representation of cumulative returns from the course lecture is provided below:
Quizzes
Which statistic is best to use to determine buy / sell signals?
- rolling sum
- global mean
- global max
- rolling standard deviation