Bonsoir
This mdBook contains notes from my self-study of binary exploitation and
reverse-engineering. If you have any questions about the contents within, you
can find my contact information on my website.
Reverse engineering
In this section, you'll find my notes on reverse engineering. This includes discussions on the following topics:
- Static reverse engineering
- Dynamic reverse engineering
- Instrumentation
- Fuzzing
- Symbolic execution
- Concolic execution
- Binary diffing
- Binary diffing tools
Static reverse engineering
Reverse engineers use static reverse engineering to inspect programs at rest, meaning not loaded into memory or currently executing. Reverse engineers utilize a series of tools to statically inspect a program in order to derive its purpose and functionality. Starting at the shallow end of analysis, the following tools are useful for static reverse engineering:
strings- the strings utility outputs all printable character sequences that are at least 4 characters long for a given file. This tool is useful for reverse engineers as it provides an initial peek at what functionality might exist within the target program.file- the file utility gives a best-effort determination of what type of file the reverse engineer is inspecting.filelooks for common ASCII strings, but also checks a file to see if it contains data structured according to known file formats like ELFs.PEiD- a Windows tool that's useful for identifying the compiler used to build a Windows PE and any tools used to obfuscate the PE being inspected.
Some tools that provide a little more sophistication for static reverse engineering are as follows:
nm- this utility lists the symbols in a provided object file or executable . Usingnmon object files just shows an object file's exported global varibles and symbols - an executable provides similar output, however, external functions that the program links against will also be present.ldd- list dynamic dependencies, this will list the libraries a dynamically linked executable uses / expects in order to implement its functionality.objdump- an extremely versatile utility for ELF inspection, this program can provide a reverse engineer the following information about a program:- Program section headers - a summary of the information for each section in
the program - e.g.:
.text,.rodata,.dynamic,.got,.got.plt, etc. - Private headers - program memory layout information and other information
required by the loader, e.g. a list of required libraries - produces similar
output to
ldd. - Debugging information
- Symbol information
- Disassembly listing -
objdumpperforms a linear sweep disassembly of the sections of the file marked as code.objdumpoutputs a text file of this listing, commonly known as adead listing.
- Program section headers - a summary of the information for each section in
the program - e.g.:
c++filt- a tool that understands and deciphers the symbol name mangling scheme of different compilers for C++ applications. Compilers mangle symbol names with some standardized formatting in order to avoid symbol collisions of symbols within different namespaces.c++filtnot only de-mangles the symbol output of tools likenmong++compiled programs, but is also able to identify and fix paramters passed to previously mangled symbols.
Finally, at the deep end of static reverse engineering tools:
ndisasm- a stream disassembler, this utility doesn't require the data inspected to be a valid program. It just takes a stream of bytes and attempts to accurately disassemble the bytes to provide readable assembly code. Of course you'll have to providendisasmwith the suspected target architecture and pointer size (32bit or 64bit).IDAPro- created by HexRays, IDAPro is a static reverse engineering tool that conducts disassembly and decompliation of a target program and uses a proprietary technology called FLIRT (Fast Library Identification and Recognition Technology) for standard library function recognition.Ghidra- a crowd favorite, Ghidra is a static reverse engineering tool that disassembles and decompiles a target program using a recursive descent algorithm. Without going too in depth into the differences between linear sweep and recursive descent disassembly, Ghidra follows branches , functions calls, returns, etc. when disassembling a target binary. This is in contrast to objump which disassembles blocks of bytes which can be assumed to be valid instructions. Recursive descent disassembly provides the reverse engineer with more context and usually more accurate results for disassembled programs.Binary Ninja- created by Vector35 and similar to both IDAPRo and Ghidra, Binary Ninja is pretty good at providing a high level intermediate language representation of a target program. Like IDAPro and Ghidra, Binary Ninja allows reverse engineers to program scripts against its API - this is usually done to fix known issues with disassembly or provide general quality of life improvements.
Pros of Static Reverse Engineering
Reverse engineers can utilize static reverse engineering to gather information about a target binary without having to load and execute that binary in memory. This is most useful when a reverse engineer needs to gather information about a malicious program but wants to avoid having that malicious program execute its functionality on the reverse engineer's system. Static reverse engineering is also useful when the reverse engineer does not have the requisite system(s) to load and execute a target for dynamic analysis. This scenario is common when inspecting programs extracted from embedded devices or real-time operating systems. These programs are usually compiled for a different architecture than the reverse engineer's machine and expect special / custom devices to be present in order to implement their functionalities. Static reverse engineering allows analysts the time and ability to deeply inspect a target program and, with tools like Ghidra and IDAPro, an analyst can generate and analyze control flow graphs (CFG)s, data dependencies, decompiled code, etc. Finally, reverse engineers can easily collaborate when conducting static reverse engineering. The Ghidra Server is a prime example of this, providing change control for a repository of programs as analysts comment, label, and update listings.
Cons of Static Reverse Engineering
Try as we might, some things can't be answered by static reverse engineering. Often times, if the author of a program intends upon protecting their intellectual property - or if the author is a malware developer - programs can come packed / compressed. These usually contain a decoder stub that will unpack the real program to be executed into the process memory. A number of unpacking programs exist that help reverse engineers get back to statically analyzing their targets, however, it's possible a paranoid malware author could invent their own packer / unpacker with custom encryption, etc.
This increase in sophistication requires reverse engineers to conduct deeper inspection on custom unpacking algorithms written by malware authors. Luckily, tools like Ghidra, Binary Ninja, and IDAPro provide scripting interfaces that allow reverse engineers to write and execute custom scripts. This enables reverse engineers with the ability to operate on the disassembly programatically, making the unpacking of custom packed malware more feasible.
Dynamic reverse engineering
Dynamic reverse engineering is utilized by analysts to derive conclusions that can't be discovered with static reverse engineering. In order to conduct dynamic reverse engineering, analysts load and execute the program of inspection (POI) into memory in a controlled environment. Analysts usually attempt to recreate the exact environment the POI normally executes in order to remove any variables that might cause differences for exploit development. The following are some technologies and techniques used to accomplish dynamic reverse engineering:
- Containerization - analysts can place POIs into containers using technologies like Docker. This allows analysts to control the POI's use of system resources and software packages. Containerization is useful in identifying a POI's dependencies and enables the recreation of a POI's exploitable environment. Containers are a excellent choice for quickly creating lightweight, virtualized environments for dynamic reverse engineering and exploit development.
- Virtualization - virtualization technologies like VMware, VirtualBox, and QEMU allow analysts to create an entire Guest Operating System running the POI's intended Operating System, managed by a hypervisor on the Host Operating System . These virtualization technologies are useful for dynamic reverse engineering because the analyst can control the Guest Operating System's resources, e.g. network cards, graphics cards, host dynamic memory, disk memory, etc. Full virtualization also makes virtualization entirely transparent to the Guest Operating System - all system calls are translated by the hypervisor to the host machine without the Guest OS's awareness. This is useful for the inspection of POI's with more sophisticated virtualization detection mechanisms.
- QEMU user-mode emulation - this project recevies its own bullet due to its
usefulness for dynamic reverse engineering. QEMU's user-mode emulation through
programs found in the
qemu-user-staticpackage allows analysts to load and execute programs compiled for different architectures. Not only that, it provides an easy interface for changing the POIs environment variables, library loading behavior, system call tracing, and remote debugging. Knowledge and use of QEMU's user-mode emulation is a must for analysts attempting to reverse engineer embedded software. - Function call hooking - during dynamic reverse engineering, sometimes programs execute function calls to external libraries expecting specific responses in order to continue execution. A majority of the time, analysts are unable to recreate the correct environment in order to correctly service these external library function calls, thus the program aborts or exits before executing any interesting behavior. Analysts combat this by writing hooks in C and compiling shared objects for dynamically-linked POIs, intercepting a POI's external library function calls and returning correct values so that the program can continue execution without failure.
- Debugging - with utilities like
gdborwindbg, analysts can examine the process stack, heap, and registers while a POI executes in process memory. This deep inspection allows analysts to truly understand how a POI behaves, what return values it expects from internal and external subroutines, and also opens a window to extracting packed / encrypted programs from process memory after decoding. - Symbolic execution - symbolic execution, sometimes known as symbolic analysis, is a technique used to derive the inputs to a program that satisfies a constraint for a specific path of execution. A symbolic execution engine will analyze a specific slice of the program and determine what variables are used to reach a target address. From here, a symbolic execution engine can conduct "concolic execution", a term used to describe a mix of symbolic and concrete execution wherein the engine determines the satisfiability contraints for a path of execution and tests different inputs to inspect their side effects. Symbolic analysis has various security applications and use cases for reverse engineers, enabling them with the ability to find vulnerabilities, generate exploits, and conduct full code coverage for malware specimens.
Pros of Dynamic Reverse Engineering
Reverse engineers can utilize dynamic reverse engineering to answer questions that can't be satisfied by static reverse engineering. In addition, dynamic reverse engineering allows analysts to understand the behavior of programs that have been packed or encrypted, allowing them to unpack or decrypt themselves prior to being loaded into memory by the decompression / decoder stub of the program. Using this technique, analysts can dump the program from process memory onto the disk for further static analysis.
During dynamic reverse engineering, analysts can gradually provide POIs with necessary resources to inspect behavioral changes. This technique is most commonly used with programs that receive command and control (C2) communications from a source on the Internet - allowing POIs to have access to a network card within a controlled environment.
Dynamic reverse engineering allows analysts to understand the true intent of a POI, if it wasn't already readily apparent during static analysis. Because most analysis occurs within a virtual environment, an analyst can execute the program without risk to lab infrastructure or information - this is useful for the inspection of malware like ransomware, wipers, worms, etc.
Cons of Dynamic Reverse Engineering
There will always be inherent risk in executing code that you didn't write yourself. It's entirely possible that a POI utilizes some undisclosed jailbreak / sandbox escape that could cause harm to the analyst's workstation. In addition, most malware today comes with functionality to detect virtualization or debugging techniques. Some malware even goes so far as to report an analyst executing the malware within a sandbox environment - alerting the malware author to update or change the program distribution to hamper reverse engineering efforts.
Despite all best efforts, sometimes it will be impossible to recreate the POIs operating environment. Using dynamic reverse engineering, analysts have to make assumptions that might not always be correct - this can cause analysts to focus on unimportant features of the POI or paths of execution that may never take place in the real environment.
Virtualization for dynamic reverse engineering also has its limitations. A prime example of this is the Spectre security vulnerability. [1] This vulnerability affects modern processors that perform branch prediction - attackers can leverage the side effects of speculative execution and branch misprediction to reveal private data. It would be infeasible for a reverse engineer to inspect a malware specimen exploiting this vulnerability from a virtualized environment. Likely, the reverse engineer would have to conduct debugging and analysis on a physical processor.
References
Dumb fuzzing
Foreword
Before we begin our discussion on fuzzing techniques, note that the terms and definitions used by different fuzzing publications, tools, etc. are not congruent. Currently, there doesn't seem to be a standard language when discussing ideas and concepts related to fuzzing - every blog or article is using terms and definitions differently.
Because of this, all of the language we will use for this and future discussions on fuzzing will be derived from [1]. It's an excellent resource that pulls together the most popular fuzzing tools and publications and attempts to standardize our understanding of the fuzzing process as well as all of the terms and techniques associated with fuzzing.
Model-less fuzzing (dumb fuzzing)
Fuzzers are used to generate input for programs under test (PUTs), attempting to find inputs that crash the program - a crash being some sort of unrecoverable state like a segmentation fault. Being programmers ourselves, we understand that most programs have vulnerabilities in only very specifc sections of code, requiring specific inputs to traverse an execution path that reaches the vulnerable code.
Model-less fuzzers, or dumb fuzzers, generate input data for PUTs without any knowledge of the structure required for the data expected by the PUT. A good example provided by [1] is the fuzzing of an MP3 player application. MP3 files have a particular structure that needs to be met and, if the MP3 player application is provided an invalid file, it will exit without executing further code. In this example, unless the model-less fuzzer is provided with some initial seed data, the model-less fuzzer will be unable to traverse further execution paths until it correctly guesses the data structure expected by the MP3 player application - this is an infeasible approach to exploitation.
Model-less fuzzers are mutation-based, all of the input they generate for PUTs is based off of a set of seeds provided by the researcher. Seeds are input data that can be correctly ingested by the PUT and allows the fuzzer to reach sections of code that are usually executed after the input data is validated. Seeds are usually derived from real-world application use. Once the model-less fuzzer is provided with enough seeds, the fuzzer will generate mutations of the seeds as test cases for the PUT.
Bit-Flipping
Bit-flipping is a common technique used by model-less fuzzers to mutate
seeds and generate test cases for PUTs. The fuzzer flips a number of bits in
the seed, whether it be random or configurable is determined by the
implementation of the fuzzer. Bit-flipping, model-less fuzzers that allow
user-configuration usually employ a configuration parameter called the
mutation ratio, a ratio defined as K random bits in an N-bit seed:
K/N.
Arithmetic Mutation
Arithmetic mutation is a mutation operation where a selected byte sequence
is treated as an integer and simple arithmetic is performed on it by the
fuzzer. For instance, AFL selects a 4-byte value from a seed and then replaces
the integer within that seed with a value +/- some random, small number r.
Block-based mutation
Block-based mutation involves:
- Inserting a randomly generated block of bytes into a random position in a seed.
- Deleting a randomly selected block of bytes from a seed.
- Replacing a randomly selected block of bytes with a random value in a seed.
- Generating random permutations for the order of blocks in a seed.
- Resizing seeds by appending random blocks.
- Randomly switching blocks of different seeds.
Dictionary-based mutation
Dictionary-based mutation involves a fuzzer using a set of pre-defined
values with significant semantic weight, for example 0,-1, or format
strings, for mutation.
Feedback and evaluation
So how does a fuzzer detect the discovery of an interesting input? Model-based and model-less fuzzers both leverage the use of bug oracles for input evaluation. A bug oracle is a part of the fuzzer that determines whether a given execution of the PUT violates a specific security policy. Usually, bug oracles are designed to detect segmentation faults but, with the implementation of sanitizers, fuzzers can also detect unsafe memory accesses, violations of control flow integrity, and other undefined behaviors.
Problems with model-less fuzzing
A practical challenge that model-less, mutation-based fuzzing faces is a program's use of checksum validation, a primary example being the use of a cyclic redundancy check (CRC). A CRC is an error-detecting code that ensures that the integrity of the data contained in the input file is preserved during transmission. If a PUT computes the checksum of an input before parsing it, it's highly likely that most of the test input provided by the fuzzer will be rejected.
In this case, model-base fuzzing of the PUT is more likely to succeed, as showcased in Experiment 2 of [2]. During the experiment, the model-based fuzzer had full knowledge of how the input data was to be structured, including how the checksum was generated. This allowed the fuzzer to achieve greater code coverage than any of the model-less, mutation-based fuzzer implementations.
References
- https://arxiv.org/pdf/1812.00140.pdf
- https://www.ise.io/wp-content/uploads/2019/11/cmiller_defcon2007.pdf
Instrumentation
Before we begin a discussion on instrumentation, let's define the different types of fuzzing because they can be categorized based upon the amount of instrumentation they leverage.
Black-box fuzzers
Black-box fuzzers use fuzzing techniques that do not see the internals of programs under test (PUTs). Black-box fuzzers make decisions upon the input/output behavior of the PUT. These types of fuzzers are colloquially called IO-driven or data-driven in the software testing community. [1]
White-box fuzzers
White-box fuzzers generate test cases by analyzing the internals of a PUT, exploring the state space of the PUT systematically. White-box fuzzing is also called dynamic symbolic execution or concolic testing (concrete + symbolic) . What this basically means is that the fuzzer leverages concrete and symbolic execution simultaneously, using concrete program states to simplify symbolic constraints. [1]
Grey-box fuzzers
Grey-box fuzzers are able to obtain some information about a PUT and its executions. In contrast with white-box fuzzers, grey-box fuzzers only perform lightweight static analysis on the PUT and gather dynamic information during program execution such as code coverage - they utilize approximate information in order to speed up the rate of testing. [1]
Instrumentation
Grey and white-box fuzzers instrument the PUT to gather feedback for each execution of the program. Black-box fuzzers don't leverage any instrumentation so they won't be discussed in this section. What is instrumentation? [1] defines two categories:
- Static program instrumentation - instrumentation of a PUT before it is executed. This is usually done at compile time on either source code or an intermediate representation. An good example is how AFL instruments every branch instruction of a PUT in order to compute branch coverage. This feedback allows AFL to choose test cases that are more likely to traverse more or newer branches of a PUT.
- Dynamic program instrumentation - instrumentation of a PUT while the program is being executed. Dynamic instrumentation provides the advantage of easily instrumenting dynamically linked libraries because the instrumentation is performed at runtime. Leveraging dynamic program instrumentation provides a fuzzer with a more complete picture of code coverage as its able to obtain information from external libraries.
So how does this aid fuzzers?
As stated earlier, instrumentation provides execution feedback to grey and white-box fuzzers, providing the fuzzers with information useful for making decisions on which seeds to prioritize for the generation of input data. Fuzzers leverage feedback from instrumented PUTs to generate statistics and track which portions of the code have been traversed and which execution paths are most likely to produce a crash.
Instrumentation also aids fuzzers through in-memory fuzzing. In-memory fuzzing is when a fuzzer only tests a portion of the PUT without respawning the process for each fuzz iteration. This is often useful for large applications that use a GUI and often need time to execute a significant amount of initialization code. The fuzzer can take a memory snapshot of the PUT right after it has been initialized and then utilize this memory snapshot to begin the fuzzing campaign. Instrumentation used in this manner increases the speed in which a fuzzer can execute test cases to find crashing input.
References
Coverage-based fuzzing
We've somewhat discussed code-coverage based fuzzing in the previous sections when talking about grey-box testing or the AFL fuzzer, but here we'll actually provide a concrete definition, some examples, and references.
Code-coverage based fuzzing is a technique that programmers and fuzzers use in order to uncover as many bugs as possible within a program. In previous sections we talked about mutation-based fuzzing and generating random input with dumb fuzzers in an attempt to generate a crash, but those techniques aren't super helpful if the program never uses all of its code to evaluate our input. Code-coverage based fuzzing solves this argument, the more code we execute within a program the more likely we are to find a bug.
Examples and resources
The Fuzzing Book
First I'll start with the The Fuzzing Book's article on code-coverage based fuzzing. This article explains code-coverage based fuzzing in depth and provides examples for Python and C applications. The article conducts code-coverage based fuzzing for a CGI decoding application, an application that takes URL encoded strings and reverts them to their original text.
In this article, the author also takes the time to make the distinction between black-box fuzzing and white-box fuzzing, and how white-box fuzzing enables code-coverage based fuzzing. Without instrumentation, we aren't able to conduct code-coverage based fuzzing because the fuzzer doesn't have the ability to capture which lines of code have been executed by the program under test (PUT). With instrumentation, however, we can conduct code-coverage based fuzzing for both program statements and branch instructions.
In this particular example, the author uses statement-based coverage to acquire code-coverage fuzzing statistics. Because the decoder application is so small, the author only needed to run ~40-60 fuzzing iterations to cover all lines of code in the application.
Fuzzing with Code Coverage by Example
This presentation given by Charlie Miller at Toorcon 2007 provides some good historical context and expands upon the advancements made towards mutation-based, generation-based, and code-coverage based fuzzing. It's a thorough explanation with some great examples and pratical exercises for code-coverage based fuzzing. The most interesting part is its mention of evolutionary algorithms for code-coverage based fuzzing, and how mutation-based , model-less fuzzers can utilize the feedback provided by code-coverage based fuzzing to select more "fit" inputs.
Fuzzing by Suman Jana
This presentation by Suman Jana from Columbia University in the City of New York, provides a more recent synopsis of code-coverage based fuzzing. This presentation covers one of the more popular fuzzers in the research community that uses code-coverage based fuzzing, American Fuzzy Lop (AFL). AFL is a model-less, mutation-based, grey-box fuzzer that leverages instrumentation at compile time to conduct branch-based code-coverage fuzzing. Throughout a fuzzing campaign, AFL will use its instrumentation to evaluate what branches a particular seed was able to cover. AFL attempts to generate a pool of seeds that cover as much of the program as possible, and also trims seeds from the pool to produce the minimum required input to cover sections of code.
Evolutionary Algorithms
An Evolutionary Algorithm (EA) uses biological evolution mechanisms such as mutation, recombination, and selection to maintain a seed pool of "fit" input candidates for a fuzzing campaign, and new candidates can be discovered and added to this seed pool as more data is collected. Most grey-box fuzzers leverage EAs in tandem with node or branch coverage to generate seeds, preserving seeds that discover new nodes or branches and trimming seeds until the minimum amount of input required to cover a branch is discovered. The implementations of EAs across different grey-box fuzzers varies, but they all end up achieving similar goals using this feedback mechanism. [4]
References
- https://www.fuzzingbook.org/html/Coverage.html#
- https://www.ise.io/wp-content/uploads/2019/11/cmiller_toorcon2007.pdf
- https://www.cs.columbia.edu/~suman/secure_sw_devel/fuzzing.pdf
- https://arxiv.org/pdf/1812.00140.pdf
Symbolic execution
Symbolic execution is a program analysis technique that can be used to determine what concrete values are required to cause different parts of a program to execute. It's goals are similar to code-coverage based fuzzing, however, it's different because it's not generating and mutating a bunch of concrete input and throwing it at the program until it reaches a new execution path or branch.
Symbolic execution analyzes a program and assigns symbolic values to all expressions that cause conditional branches within a program. A symbolic execution engine maintains and generates path conditions using these symbols and expressions, providing the researcher with a symbolic representation of how to reach different execution paths within the program.
Symbolic execution engines also utilize model checkers, taking the generated path conditions for each execution path and leveraging a satisifiability modulo theories (SMT) solver, or constraint solver, to calculate the concrete values that satisfy the formulas represented by each path condition. [1]
Example
Here's an example from a presentation on symbolic execution from the University of Maryland [2]:
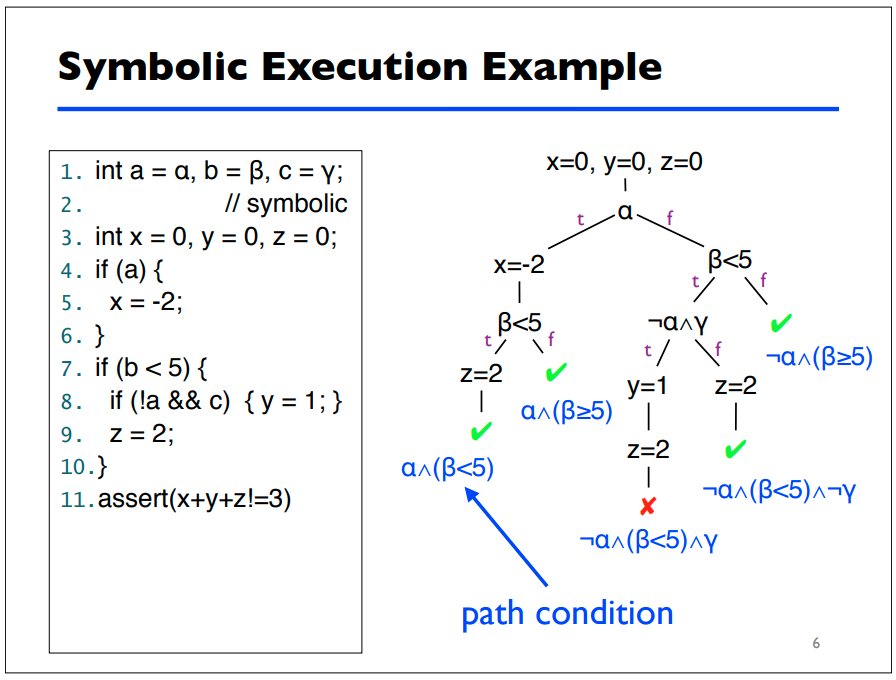
This example provides the reader with a solid breakdown of how path conditions
are generated for different paths of execution in a small snippet of code. The
symbolic execution engine will provide to the tester what conditions need to be
true for the assert call to fail. From there, the engine can also derive
concrete values for each symbol that will cause the program to fail the
assertion.
Concolic execution
Dynamic symbolic execution or concolic execution is a form of white-box fuzzing that conducts symbolic execution while the program is being executed with concrete values. Like we discussed earlier, this form of white-box fuzzing is possible through instrumentation of the PUT. The symbolic execution engine is able to recieve feedback on the concrete input it provides to the PUT allowing it to derive symbolic constraints for different paths of execution more efficiently. The algorithm for concolic execution is actually explained pretty well in the concolic testing Wikipedia article. [3].
Applications
Symbolic execution is useful for software verification and testing because, unlike static analysis tools, symbolic execution will never produce false positives for software errors. Symbolic execution is useful for software engineering because its final product is a concrete input that will cause the program under test (PUT) to fail a specification. Various different symbolic execution engines and tools have been used across the industry by software engineers and hackers alike to find security vulnerabilities.
Limitations
There are some properties of programs that can hinder program analysis using symbolic execution. A quick listing and short description of these limitations referencing [1] can be found below:
- Memory - symbolic execution engines have a hard time handling pointers, arrays, and other complex objects like the contents of data structures stored on the heap.
- Environment - symbolic execution engines don't account for things like calls to other libraries, file system operations, etc. A symbolic execution engine could be testing path conditions that contain file operations for some static filename. Unlike the tests being conducted by the engine, the state of the file is permanent and thus, if the contents of the file are used for conditional branches or expressions, this could cause non-deterministic outcomes for different tests conducted by the engine.
- Path explosion - symbolic execution engines don't scale well when testing large programs - the number of feasible paths in a program grows exponentially with program size. The number of feasible paths tracked by an engine can also become infinite given some loop exists within the program that contains an unbounded number of iterations.
References
- https://arxiv.org/pdf/1610.00502.pdf
- https://www.cs.umd.edu/~mwh/se-tutorial/symbolic-exec.pdf
- https://en.wikipedia.org/wiki/Concolic_testing
Binary diffing
Binary diffing or patch diffing is a technique that compares two binaries derived from the same code with the goal of discovering their differences and revealing any technical details that weren't covered in the changelogs, bulletins, or patch notes for an update. Researchers use binary diffing to compare known-vulnerable binaries to post-patch binaries in an attempt to suss out how a vulnerability was patched by the author. It's common for researchers to also find a way around a discovered patch or the patch can also expose other vulnerabilities within the binary that were previously overlooked.
Vulnerabilities discovered through binary diffing are colloquially termed 1-day bugs / vulnerabilities as they are usually discovered the day after a patch is released. 1-day bugs can be used to exploit and compromise users or organizations that are slow to adopt the newest security patches.
Binary diffing is also useful for discovering security patches within entire code cores for products. In the case of this Google Project Zero article, the researcher leverages binary diffing to discover kernel memory disclosure bugs in the Windows operating system core - bugs that can be useful to defeat kernel ASLR in other exploits.
Limitations
Most of the examples online that aim to teach binary diffing use simple programs with small changes, however, in real-world scenarios binary differs do face some obstacles. Here are a few examples as listed by an Incibe-Cert article on binary diffing [2]:
- Unrelated differences - it's common that changes in the compiler or compiler optimizations can cause small differences to manifest between two different binaries. A security researcher must be able to identify when a difference between two binaries is unrelated to a patch.
- Bugfixes not related to a vulnerability - sometimes bugfixes are present in a new version of the binary that are completely unrelated to the vulnerability of interest.
- Obfuscation and anti-diffing techniques - some authors and organizations purposefully obfuscate and leverage anti-diffing techniques for patches to prevent researchers from finding vulnerabilities or reverse-engineering patches to previous vulnerabilities. This BlackHat 2009 presentation by Jeongwook Oh goes into great detail about binary diffing and various obfuscation and anti-diffing technologies.
References
- https://googleprojectzero.blogspot.com/2017/10/using-binary-diffing-to-discover.html
- https://www.incibe-cert.es/en/blog/importance-of-language-binary-diffing-and-other-stories-of-1day
- https://www.blackhat.com/presentations/bh-usa-09/OH/BHUSA09-Oh-DiffingBinaries-SLIDES.pdf
Binary diffing tools
Diaphora
Diaphora, Greek for "difference", is a binary diffing project and tool started by Joxean Koret, originally released in 2015. Diaphora is advertised as the most advanced binary diffing tool that works as an IDA Pro plugin. IDA Pro is a licensed disassembler and debugger for state-of-the-art binary code analysis.
Diaphora features all of the common binary diffing techniques such as:
- Diffing assembler.
- Diffing control flow graphs.
- Porting symbol names and comments.
- Adding manual matches.
- Similarity ratio calculation.
- Batch automation.
- Call graph matching calculation.
And it also comes with many more advanced features listed in its README.md.
An IDA Pro license comes at a hefty price, however, the contributors to
Diaphora have advertised that support for Ghidra and Binary Ninja are being
actively developed. Ghidra is a free software reverse
engineering suite of tools developed by the National Security Agency (NSA).
Binary Ninja is another licensed reversing platform developed by
Vector 35.
Bindiff
Bindiff is another binary diffing tool developed by Zynamics and works as a plugin for IDA Pro, as well. Here are some of its use cases as advertised on their web page:
- Compare binary files for x86, MIPS, ARM, PowerPC, and other architectures supported by IDA Pro.
- Identify identical and similar functions in different binaries.
- Port function names, anterior and posterior comment lines, standard comments and local names from one disassembly to the other.
- Detect and highlight changes between two variants of the same function.
It's not all about IDA Pro; As of March 1, 2020, Zynamics released Bindiff 6 which provides experimental support for Ghidra. Open-source research has been conducted to generate a plugin for these new features and a plugin called BinDiffHelper is currently available that aims to provide easy-to-use support for Bindiff 6 with Ghidra.
Radiff2
Radiff2 is Radare2's binary diffing utility. Radare2 is a rewrite from scratch of Radare in order to provide a set of libraries and tools to work with binary files. The Radare project started as a forensics tool, a scriptable command-line hexadecimal editor able to open disk files, but later added support for analyzing binaries, disassembling code, debugging programs, attaching to remote gdb servers, and so on.
Radiff2 is open-source and attempts to provide the same utility and functionality as the binary diffing tools listed above without having to cater to licensed tools like IDA Pro and Binary Ninja.
References
- https://github.com/joxeankoret/diaphora
- https://www.hex-rays.com/products/ida/
- https://ghidra-sre.org/
- https://binary.ninja/
- https://www.zynamics.com/bindiff.html
- https://github.com/ubfx/BinDiffHelper
- https://r2wiki.readthedocs.io/en/latest/tools/radiff2/
- https://github.com/radareorg/radare2
Common vulnerabilities
In this section, you'll find my notes on common vulnerabilities that you may find during reverse engineering and how to exploit them. This includes discussions on the following topics:
- Stack buffer overflows
- Heap buffer overflows
- Use after free
- Heap grooming
- Race conditions
Stack buffer overflow
The stack
Before we talk about overflowing data structures on the stack, let's define what the stack is.
The stack is a data structure with two principal operations, push and pop.
The stack follows a last in, first out (LIFO) convention meaning the
top-most element of the stack is the first to be removed from the data
structure when a pop operation occurs. Newer values are pushed to the top
of the stack and cannot be removed until succeeding values are poped from the
stack. [1]
The rest of our discussion is related to the process stack of ELF binaries. Each process has a contiguous segment of memory that is set aside to store information about the active subroutines of the program. The initial stack layout provides the process access to the command line arguments and environment used when executing the program. An example of the initial process stack can be found below [2]:
argc            // argument count (int)
argv[0]         // program name (char*)
argv[1]         // program arguments (char*)
...
argv[argc-1]
NULL            // end of arguments (void*)
env[0]          // environment (char*)
...
env[n]
NULL            // end of environment (void*)
The stack can be implemented to grow down (towards lower memory addresses) or
up (towards higher memory addresses). Most common stack implementations grow
downwards as data is pushed to the stack and this is what we will use for
this discussion. A register called the stack pointer is used to track
the last address of the stack, the most recent element pushed to the stack.
Many compilers also use a second register, the frame pointer, to reference
local variables and parameters passed to functions.
Stack frames
The stack is used to implement functions for programs. For each function call, a section of the stack is reserved for the function - a stack frame. Below is some example C code that we will use for the rest of our stack frame discussion:
int my_function(int a, int b) {
    char buffer[32];
    return a + b;
}

int main(int argc, char** argv) {
    my_function(1, 2);
    return 0;
}
Example assembly language output for the call to my_function() could be:
push    2               // push arguments in reverse
push    1
call    my_function     // push instruction pointer to stack and jump
                        // to beginning of my function
The above assembly code follows the cdecl calling convention, we'll also use
this calling convention for the rest of our discussion. The above assembly code
showcases how the arguments for the callee function, my_function(), are being
passed to the function by the caller, main, using the stack. The call
instruction pushes the instruction pointer onto the stack. This will be used
by a ret instruction to return to the caller. [3]
Entering my_function(), we'll see the function prologue setting up the
stack frame. Here's an example of what this would look like:
push    rbp         // save the frame pointer of the caller to the stack
mov     rbp, rsp    // set the new frame pointer
sub     rsp, 64     // make space for char buffer[32]
Below is an example of what the stack frame would look like for my_function()
:
0xdeadbeefcafe0000      buffer[0]               // rsp
...
0xdeadbeefcafe0040      buffer[31]              // end of buffer
0xdeadbeefcafe0048      saved frame pointer     // rbp
0xdeadbeefcafe0050      return address
0xdeadbeefcafe0058      a
0xdeadbeefcafe0060      b
Functions use the rbp and relative addressing to reference local variables
and parameters passed to the function.
Lastly, we have the function epilogue which reverses the actions of the prologue, restoring the caller's stack frame and returning to the caller. An example function prologue follows:
leave   // mov rsp, rbp; pop rbp;
ret
The leave instruction moves the rsp back to where it was before we entered
the function, directly after the caller executed the call instruction. The
rbp is also restored so the caller can correctly access the contents of its
stack frame when it resumes execution. The ret instruction sets the program
counter to the return address now contained at the top of the stack.
[4]
Buffer overflows
Finally, we can talk about stack buffer overflows and how they can be used to hijack the execution of a process. Stack buffer overflow vulnerabilities are a child of the out-of-bounds write weakness and are a condition in which a buffer being overwritten is allocated on the stack. [5][6] Provided below is some example C code that contains a stack buffer overflow vulnerability:
#define MAX_SIZE 64

int main(int argc, char** argv) {
    char buffer[MAX_SIZE] = {0};
    strcpy(buffer, argv[1]);

    return 0;
}
In this example, the size of argv[1] is not being checked prior to writing
its contents to the stack buffer, char buffer[MAX_SIZE]. If argv[1] is
greater than MAX_SIZE, the strcpy() operation will copy the contents of
argv[1] to buffer but will also overwrite the bytes directly after the
buffer variable on the stack.
Referencing the stack frame layout examples provided earlier, we can see that this out-of-bounds write on the stack can lead to the corruption of sensitive stack data, specifically the saved frame pointer and the return address.
So how can this lead to arbitrary code execution?
Stack information that is usually targeted by an attacker to gain code execution is the return address. Overwriting this, an attacker can redirect code execution to any location in memory in which the attacker has write access. Historically, the first in-depth article that demonstrates using a stack buffer overflow to gain arbitrary code execution is Smashing The Stack For Fun And Profit by Aleph One.
As smashing the stack became more popular, various mitigations were implemented
to protect sensitive information on the stack from being overwritten, e.g.
stack canaries. Another mitigation involves setting permissions for segments of
memory within a process, and setting the permissions of the stack to be
read/write only - preventing the execution of shellcode stored in the stack.
These mitigations led to the creation of the ret2* techniques and return
oriented programming (ROP).
Other important stack information that can be targeted is the stack pointer and the saved frame pointer. These values are used to conduct relative addressing of variables within the stack frame, their corruption can be leveraged to complete a "write-what-where" condition. Corruption of the stack pointer and saved frame pointer can also be used to conduct a stack pivot, allowing the attacker to control the location and contents of the stack frame used by the calling function when it resumes execution.
References
- https://web.archive.org/web/20130225162302/http://www.cs.umd.edu/class/sum2003/cmsc311/Notes/Mips/stack.html
- http://asm.sourceforge.net/articles/startup.html
- https://www.agner.org/optimize/calling_conventions.pdf
- http://jdebp.eu./FGA/function-perilogues.html
- https://cwe.mitre.org/data/definitions/787.html
- https://cwe.mitre.org/data/definitions/121.html
- http://phrack.org/issues/49/14.html
Heap buffer overflow
What is a heap?
Heaps are contiguous blocks of memory chunks which malloc() allocates
to a process. Heaps are dynamic in nature, so memory can also be free()d
by a process when the memory is no longer needed. Heap memory is global and
can be accessed and modified from anywhere within the process when referenced
with a valid pointer. Heaps are treated differently depending on whether
they belong to the main arena or not - more on arenas later.
Heaps can be created, extended, trimmed, and destroyed. The main arena
heap is created during the first request for dynamic memory while heaps for
other arenas are created with the new_heap() function. The main arena
heap grows and shrinks with the use of the brk() or sbrk() system calls.
These system calls are used to change the location of the program break,
defining the end of the process's data segment. Increasing the
program break allocates memory to the process; decreasing the break
deallocates memory. [1]
What is a chunk?
Chunks are the fundamental unit of memory that malloc() deals in, they are
pieces of heap memory. An allocated chunk in the heap is structured like this:
            word/qword          |           word/qword

+-+-+-+-+-+-+-+-+-+-+-+-+-+-+-+-+-+-+-+-+-+-+-+-+-+-+-+-+-+-+-+-+-+-+
|           prev size           |           chunk size        |A|M|P|
|   (not used while allocated)  |                                   |
+-+-+-+-+-+-+-+-+-+-+-+-+-+-+-+-+-+-+-+-+-+-+-+-+-+-+-+-+-+-+-+-+-+-+
|           user data           |           user data               |
+-+-+-+-+-+-+-+-+-+-+-+-+-+-+-+-+-+-+-+-+-+-+-+-+-+-+-+-+-+-+-+-+-+-+
|           user data           |       size of next chunk    |A|M|P|
+-+-+-+-+-+-+-+-+-+-+-+-+-+-+-+-+-+-+-+-+-+-+-+-+-+-+-+-+-+-+-+-+-+-+
The flags at the end of the second word/qword represent these chunk
properties:
- A (
NON_MAIN_ARENA) -0for chunks in the main arena. Each thread spawned receives its own arena and for those chunks, this bit is set. - M (
IS_MMAPPED) - The chunk was obtained usingmmap(). - P (
PREV_INUSE) -0when the previous chunk is free. The first chunk allocated will always have this bit set. [3]
The minimum usable chunk size is 0x20, and chunk sizes increase in
increments of 16 bytes: 0x20, 0x30, 0x40, etc.
The top chunk
The top chunk is the "topmost available chunk, i.e. the one bordering the end
of available memory". Requests are only serviced from a top chunk when they
can't be serviced from any other bins in the same arena. malloc() keeps
track of the remaining memory in a top chunk using its chunk_size field,
and the PREV_INUSE bit of a top chunk is always set. A top chunk always
contains enough memory to allocate a minimum-sized chunk and always ends on a
page boundary. [4]
What is an arena?
malloc() administrates a process's heaps using malloc_state structs, or
arenas. Arenas contain bins, data strucutures used for recycling
free chunks of heap memory. Definitions for each type of bin can be found
below:
fastbins
- A collection of singly linked, non-circular lists that each hold free chunks of a specific size.
- The first
word/qwordof a chunk's user data is used as the forward pointer (fd) when linked into a fastbin. - fastbins are LIFO data structures.
- Free chunks are linked into the fastbin if the tcachebin is full.
- For memory requests, the fastbin is searched after the tcachebin and before any other bin.
- There are 10 fastbins with chunk sizes:
16..88bytes. [2]
unsortedbin
- A doubly linked, circular list that holds free chunks of any size; essentially used to optimize resource requests.
- Free chunks are linked directly into the head of an unsortedbin when the tcachebin is full or they are outside tcachebin size range.
- The first
word/qwordof a chunk's user data is used as the forward pointer (fd) and the secondword/qwordis used as a backwards pointer (bk) when linked into an unsortedbin.- In versions of GLIBC compiled without the tcachebin, free chunks are linked directly into the head of an unsortedbin when they are outside fastbin range.
- The unsortedbin is searched after the tcachebin, fastbin, and smallbins when the request size fits those ranges, but before the largebins.
- unsortedbin searches begin from the back and move towards the front.
- If a request fits a chunk within the unsortedbin, the search is stopped and the memory is allocated, otherwise the chunk is sorted into a smallbin or largebin. [2]
smallbins
- A collection of doubly linked, circular lists that each hold free chunks of a specific size.
- Free chunks are only linked into a smallbin when the chunk's arena sorts the unsortedbin.
- The first
word/qwordof a chunk's user data is used as the forward pointer (fd) and the secondword/qwordis used as a backwards pointer (bk) when linked into a smallbin. - smallbins are FIFO data structures.
- For memory requests, smallbins are searched after the tcachebin, after fastbins if the request was in fastbin size range, and before any other bins are searched if the request was in smallbin range.
- There are 62 smallbins with chunk sizes:
16..512bytes (32-bit),16..1024bytes (64-bit). [2]
largebins
- A collection of doubly linked, circular lists that each hold free chunks within a range of sizes.
- Free chunks are only linked into a largebin when the chunk's arena sorts the unsortedbin.
- largebins are maintained in descending size order.
- The largest chunk is accessible via the bin's
fdpointer. - The smallest chunk is accessible via the bin's
bkpointer.
- The largest chunk is accessible via the bin's
- The first
word/qwordof a chunk's user data is used as the forward pointer (fd) and the secondword/qwordis used as a backwards pointer (bk) when linked into a largebin. - The first chunk of its size linked into a largebin has the third and fourth
word/qwords repurposed asfd_nextsizeandbk_nextsize, respectively. - The nextsize pointers are used to form another doubly linked, circular list holding the first chunk of each size linked into that largebin. Subsequent chunks of the same size are added after the first chunk of that size.
- The nextsize pointers are used as a skip list.
- For memory requests, largebins are searched after an unsortedbin, but before a binmap search.
- There are 63 largebins with chunk sizes starting at:
512bytes (32-bit),1024bytes (64-bit). [2]
What is a tcache?
A tcache behaves like an arena but, unlike arenas, is not shared between threads of a process. They are created by allocating space on a heap belonging to their thread's arena and are freed when the thread exits. The purpose of a tcache is to relieve thread contention for malloc's resources by allocating to each thread its own collection of chunks.
- The tcache is present in GLIBC versions >= 2.26.
- A tcache takes the form of a
tcache_perthreadstruct which holds the heads of 64 tcachebins preceded by an array of counters which record the number of chunks in each tcachebin. - tcachebins are singly linked, non-circular lists of free chunks of a specific size.
- When a tcachebin reaches it's maximum number of chunks, free chunks of that bin's size are instead treated as they would be without a tcache present.
- There are 64 tcachebins with chunk sizes:
12..516bytes (32-bit),24..1032bytes (64-bit). [2]
Heap overflow
OK, so all of the previous information was great right? It may seem like a lot, but understanding the intricacies of the GLIBC Heap is important to effectively exploit it. Now, I'll finally define what a heap overflow is:
"A heap overflow is a buffer overflow, where the buffer that can be overwritten is allocated in the heap portion of memory, generally meaning that the buffer was allocated using a routine such as malloc()." [5]
Here's an example of code that presents a heap overflow vulnerability:
#define BUFSIZE 256
int main(int argc, char **argv) {
    char *buf;
    buf = (char *)malloc(sizeof(char)*BUFSIZE);
    strcpy(buf, argv[1]);
}
No bounds checking is conducted on argv[1] before its data is copied into
buf. strcpy() could possibly copy data from argv[1] well past the bounds
of the chunk that was allocated on the heap to hold buf.
Heap overflows are a dangerous weakness for a an application to have and, given the right circumstances, attackers can utilize a variety of techniques to gain arbitrary code execution. Techniques to exploit heap overflows have been studied since the early 2000's and we'll cover a number of these techniques in the following sections.
References
- https://www.blackhat.com/presentations/bh-usa-07/Ferguson/Whitepaper/bh-usa-07-ferguson-WP.pdf
- https://azeria-labs.com/heap-exploitation-part-2-glibc-heap-free-bins/
- https://heap-exploitation.dhavalkapil.com/diving_into_glibc_heap/malloc_chunk.html
- https://azeria-labs.com/heap-exploitation-part-1-understanding-the-glibc-heap-implementation/
- https://cwe.mitre.org/data/definitions/122.html
House of Force
This is a pretty straight-foward and easy technique to understand. To utilize the House of Force technique to gain code execution, an attacker needs the following [1]:
- Ability to conduct a heap overflow to overwrite the
top chunksize field. - Conduct a
malloc()call with an attacker-controlled size. - Conduct a final
malloc()call where the attacker controls the user data.
And the House of Force technique follows these steps:
- Attacker uses a heap buffer overflow to overwrite the
top chunksize field, usually something like0xffffffffffffffff==-1.- Because the
top chunksize field is nowULLONG_MAX, calls tomalloc()can be arbitrarily large and thetop chunkwill be offset by the size of the call, allowing the attacker to place thetop chunkpointer anywhere in memory .
- Because the
- Attacker requests a chunk of size
x, placing thetop chunkdirectly before the target that the attacker intends to write to. - Attacker uses a final allocation to create a chunk with its user data overlapping the target.
What are some good targets to overwrite?
Typically, attackers will attempt to write to these glibc symbols:
__malloc_hook__free_hook
The __malloc_hook and __free_hook symbols are used by glibc to allow
programmers the ability to register functions that will be executed when calls
to malloc() or free() are made. These can be used by a programmer to
acquire statistics, install their own versions of these functions, etc.
Attackers use these hooks to redirect program execution to memory that they
control within the program. For instance, an attacker could write the address
of their ROP chain into either hook, force the program to call malloc() or
free(), and then begin executing their ROP chain to conduct a stack pivot,
etc. It's also possible to overwrite either hook to point to a one_gadget or
system() - you get the picture.
Some other less common targets are:
- The
got.pltsection of the program - The process stack
Going after the Global Offset Table (GOT) to obtain arbitrary code execution is
only a viable option if full Relocation Read-Only (RELRO) [2]
is not enabled. Otherwise, the attacker would encounter a SIGSEV by trying to
write to memory that is not marked as writeable.
Going after the process stack is also a possibility - the attacker could try to
overwrite the return address of a stack frame if they know where it resides
in memory. Unfortunately, Address Space Layout Randomization (ASLR) makes this
difficult to achieve.
Patch
The House of Force went unpatched for 13 years, but an update was finally
made to glibc to check the size of the top chunk on 16 AUG 2018.
[3] The House of Force still works for glibc versions
less than 2.29.
References
- https://gbmaster.wordpress.com/2015/06/28/x86-exploitation-101-house-of-force-jedi-overflow/
- https://ctf101.org/binary-exploitation/relocation-read-only/
- https://sourceware.org/git/?p=glibc.git;a=commitdiff;h=30a17d8c95fbfb15c52d1115803b63aaa73a285c
House of Orange
The original House of Orange technique used a heap overflow vulnerability
to target the top chunk in its first stage of exploitation. Due to this fact,
we can determine that the House of Orange fits within this section of heap
exploitation.
The technique
The House of Orange is an interesting, but somewhat convoluted, technique to gain arbitrary code execution of a vulnerable process. The House of Orange is executed in three stages:
-
Leverage a heap overflow vulnerability to overwrite the size field of the
top chunk.- Overwrite the
top chunkwith a small size, foolingmalloc()in future requests to believe that thetop chunkis smaller than it actually is. - The new
top chunksize must be page-aligned and theprev_inusebit must be set in order to passmalloc()checks. - The attacker forces the program to make another
malloc()call with a size larger than what is currently written to thetop chunksize field. - This
malloc()call will causemalloc()tommap()a new segment of heap memory.malloc()will also determine that the new segment of heap memory and thetop chunkare not contiguous, causingmalloc()tofree()the remaining space of thetop chunk. - This newly free chunk will be too large for the fastbin, it will be linked into the unsortedbin.
- Overwrite the
-
Use the same heap overflow vulnerability and chunk to overwrite the newly freed
top chunkthat resides in the unsortedbin.- The attacker forges the metadata for a fake chunk, setting the chunk size
to
0x61, and setting thebkpointer to a chunk that overlaps_IO_list_allinglibc. - The attacker will use this to conduct an Unsortedbin Attack, writing
the memory address of the unsortedbin head in the
main arenato_IO_list_all. - The attacker uses the heap overflow to write a fake
_IO_FILEstruct into the heap, forging avtable_ptrthat points back into attacker controlled memory with the intent of overwriting theoverflowmethod of the struct tosystem().
- The attacker forges the metadata for a fake chunk, setting the chunk size
to
-
The attacker requests a chunk smaller than the forged chunk that was just created, causing
malloc()to sort the free chunk into the smallbin, triggering an Unsortedbin Attack.malloc()attempts to follow our forgedbk, however, chunk metadata checks will causemalloc()to call__malloc_printerr(), leading to aSIGABRT.- When the program begins its exit procedures, it attempts to clear the buffers of all open file streams, including our forged one.
glibcfollows_IO_list_allwhich now points to themain_arena. Themain_arenafails_IO_FILEstruct checks, andglibcmoves on to the next_IO_FILEstruct pointed to by themain_arena's fakechainmember - our smallbin.glibcinspects the forged_IO_FILEstruct the attacker created in the heap using a heap overflow and executes theoverflowmethod listed in thevtableof the forged_IO_FILEstruct. The attacker has overwritten theoverflowmethod listed in thevtableto point tosystem().- The address of the
_IO_FILEis passed to this call tosystem()- the attacker ensures that the string/bin/sh\0resides at this location, the very first word of bytes in the forged_IO_FILEstruct.
Some notes
Like I said, this technique is convoluted. The attacker needs to have the following in order to exploit this vulnerability:
- Ability to edit chunk data
- Ability to control
malloc()allocation size - Heap and
glibcaddress leak ifASLRis enabled - Heap overflow
Patch
There doesn't seem to be any specific patch that attempts to mitigate
exploitation using the House of Orange. Because there are so many
conditions necessary to effectively exploit this technique, the summation of
the mitigations applied to glibc over the years have made this technique
obsolete.
For instance, the patch applied to actually check the validity of the bk
pointer in the unsortedbin causes the Unsortedbin Attack used to execute
this technique to fail. In addition, glibc after version 2.28 no longer
traverses through all open file streams at program exit to call the overflow
method of the stream. This mitigation thwarts this techniques use of
File Stream Oriented Programming to gain code execution.
References
- https://4ngelboy.blogspot.com/2016/10/hitcon-ctf-qual-2016-house-of-orange.html
- https://ctf-wiki.github.io/ctf-wiki/pwn/linux/io_file/fsop/
Single Byte Overflows
Single byte overflows are pretty dangerous bugs to have in a program, given the
right conditions. A stack-based, single byte, NULL buffer overflow was
demonstrated in this this post in
1998, used to overwrite the LSB of the ebp causing the stack frame to be
relocated to a lower address in memory - a location in the stack that the user
controls and can forge a fake stack frame.
In 2014, Google Project Zero releases The poisoned NUL byte, 2014 edition,
demonstrating that a heap-based, single byte, NULL buffer overflow can also
be used to gain code execution. [2]
Techniques
The following subsections cover a white paper from Accenture Security that goes in-depth on different methods of exploiting a one byte heap-based buffer overflow to gain overlapping chunks and possibly code execution. [3]
Extending free chunks
A diagram for this technique can be found in section 3.2.1 of
[3]. With a one byte heap-based buffer overflow, the attacker
will write actual information to the size field of a free chunk, increasing
its size. An allocation larger than the corrupted chunk's original size will
cause the chunk to overlap into succeeding chunks.
This scenario relies on the fact that malloc() does not check the prev_size
field of the succeeding chunk when allocating a previously free()d chunk.
Extending allocated chunks
This technique is similar to the one above, it's just that the series of
operations is reordered. A diagram for this technique can be found in section
3.2.2 of [3]. Essentially, the corruption happens before the
victim, corrupted chunk is free()d. An attacker writes one byte, increasing
the size of the corrupted chunk. After the corrupted chunk is free()d,
another allocation is requested with a size greater than the original size
of the corrupted chunk, causing the corrupted chunk's user data to overlap
the succeeding chunk.
This technique exploits the fact that free() has no ability to determine if
the corrupted chunk's size field is supposed to be larger or smaller, as the
only location that contains the chunk's size metadata is the size field
corrupted by the one byte heap-based buffer overflow.
Shrinking free chunks
Here's our heap-based, single byte, NULL buffer overflow - a memory
corruption vulnerability that can lead to some interesting outcomes. A good
demonstration of this technique exists on the how2heap repo,
here. The diagram for this technique can be found in section
3.2.3 of [3].
The initial state of the program involves having three chunks allocated on the
heap, all too large for the fastbin. The chunk in the middle of these three
will have a size such that a NULL byte buffer overflow from the preceding
chunk will overwrite the size field of the middle chunk, causing it to shrink
in size. The example provided sets the middle chunk's size to 0x210 and,
after the NULL byte overflow, its size is set to 0x200.
Before the memory corruption occurs, the middle chunk is free()d. This is
required because the prev_size field of the succeeding chunk must be set to
0x210. The attacker conducts the NULL byte buffer overflow and sets the
free chunk's size to 0x200. In later updates to glibc, the prev_size
field and the size field of the chunk about to be backwards consolidated is
now checked for consistency. Attackers must now write a valid prev_size field
to the succeeding chunk before attempting this backwards consolidation.
Two chunk are now allocated from this newly free()d space, one chunk that's
not within fastbin range, and subsequent chunks that are. We want chunks that
are in fastbin range to avoid having these chunks subjected to malloc()'s
consolidation and sorting behavior. We free the first chunk of the two chunks
we just allocted, placing it in the unsortedbin.
Almost there, the attacker frees the third chunk of the original three, causing
free() to inspect the prev_size field of the third chunk and consolidating
it with the chunk that we just free()d into the unsortedbin. This free space
now overlaps the fastbin sized chunk we allocated earlier.
Finally, we allocate a chunk large enough to overlap the fastbin sized chunk
that still remains. Because of this heap-based, one byte, NULL buffer
overflow, we have allocated two chunks that overlap one another which can
easily lead to the implementation of other exploitation primitives.
Exploitation
In [3], further dicussion is provided on how to use overlapping chunks to leak sensitive information and gain code exeuction. In section 4.3.2, the authors demonstrate that they can create overlapping unsortedbin size chunks.
They free() the unsortedbin eligible chunk, and the pointer to the head of
the unsortedbin, which resides in the main_arena, is written to the fd and
bk pointers of the chunk. Because they still maintain a chunk overlapping
this now free chunk, they can leak the memory of the free chunk to obtain its
fd and bk pointers, providing them a glibc leak.
Not covered in this white paper, but possible nonetheless, is that the
allocation and free()ing of two fastbin eligible chunks can lead to a heap
location leak. If these two fastbin eligible chunks are free()d while being
overlapped by a much larger, allocated chunk, the attacker could feasibly read
the fd pointers of these fastbin free chunks to derive the base of the heap.
Finally, to gain code execution, the authors of this white paper use a Global
Offset Table (GOT) overwrite. For the application they are exploiting, the
program maintains sensitive structures within the heap and, within these
structures, there are pointers that will be used to write incoming data from
a socket connection. The authors generate two of these structures in the heap,
one to leak glibc and one to conduct arbitrary writes. The authors use the
glibc leak to derive the location of the GOT - for this application's
environment, the GOT is always a fixed offset away from the glibc base. Once
they've derived the location of free@GOT, they corrupt a heap structure's
write pointer to point to free@GOT. After this, they send a message which
causes the program to overwrite free@GOT with the pointer to system@libc.
Coercing the program to call free@plt leads to system@libc with a command
they provide.
Patch
A patch that thwarts the shrinking of chunks to gain overlapping chunks was
implemented on AUG 2018. This is referenced by the note earlier, as this patch
conducts a consistency check between the next->prev_size and victim->size
of a victim within the unsortedbin before sorting or consolidating the
victim. [5]
References
- https://seclists.org/bugtraq/1998/Oct/109
- https://googleprojectzero.blogspot.com/2014/08/the-poisoned-nul-byte-2014-edition.html
- https://www.contextis.com/en/resources/white-papers/glibc-adventures-the-forgotten-chunks
- https://github.com/shellphish/how2heap/blob/master/glibc_2.23/poison_null_byte.c
- https://sourceware.org/git/?p=glibc.git;a=commitdiff;h=b90ddd08f6dd688e651df9ee89ca3a69ff88cd0c
Use-after-free (UAF)
The Use-after-free vulnerability can be defined as the use of heap allocated memory after it has been freed or deleted. [1] This can lead to undefined behavior by the program and is commonly used by attackers to implement a Write-what-where condition. [2]
Double frees and UAF vulnerabilities are closely related, and double frees
can be used to duplicate chunks in the fastbin, eventually allowing the
attacker to acquire a pointer to free memory. [3]
Heap overflows can also lead to a UAF vulnerability, given the right
conditions. This is discussed further in the exploitation portion of
Single Byte Overflows as we leak glibc
addresses from an unsortedbin chunk using our overlapping chunk.
Provided below is an example of a UAF from OWASP.org [4]:
#include <stdio.h>
#include <unistd.h>

#define BUFSIZER1   512
#define BUFSIZER2   ((BUFSIZER1/2) - 8)

int main(int argc, char **argv) {
	char *buf1R1;
	char *buf2R1;
	char *buf2R2;
	char *buf3R2;

	buf1R1 = (char *) malloc(BUFSIZER1);
	buf2R1 = (char *) malloc(BUFSIZER1);

	free(buf2R1);

	buf2R2 = (char *) malloc(BUFSIZER2);
	buf3R2 = (char *) malloc(BUFSIZER2);

	strncpy(buf2R1, argv[1], BUFSIZER1-1);
	free(buf1R1);
	free(buf2R2);
	free(buf3R2);
}
The following sections, Fastbin Dup and Unsortedbin Attack, demonstrate how UAF vulnerabilities can be leveraged to gain arbitrary code execution.
References
- https://cwe.mitre.org/data/definitions/416.html
- https://cwe.mitre.org/data/definitions/123.html
- https://cwe.mitre.org/data/definitions/415.html
- https://owasp.org/www-community/vulnerabilities/Using_freed_memory
Fastbin Dup
While the Fastbin Dup technique can be implemented using a heap buffer overflow , the most common example used to demonstrate this technique is by using the Use-after-free (UAF) and Double Free vulnerabilities.
The technique
The steps to execute the Fastbin Dup technique are as follows:
- Leverage a Double Free vulnerability to free a victim chunk twice - this chunk must be small enough that it gets linked into the fastbin.
- Coerce the program to execute
malloc()to allocate the victim chunk from the fastbin. - Overwrite the
fdpointer of the victim chunk to point to a fake chunk that overlaps the location of our arbitrary write target.- Since the inception of this technique, there have been some
glibcmitigations implemented to check if the next chunk in the fastbin contains a valid size field. You can find fake chunk candidates near your target write location using thefind_fake_fastcommand withpwndbg.
- Since the inception of this technique, there have been some
- Coerce the program to execute
malloc()until we receive a pointer to the same victim chunk, however, this time we don't need to do anything with the user data. The chunk overlapping our write target now exists within the fastbin. - Coerce the program to execute
malloc()one last time, providing us a pointer to the chunk overlapping our write target. - Use the pointer to the fake chunk to conduct our arbitrary write.
Write targets
So what targets do we wish to write to? Well, the usual candidates are: the
__free_hook, __malloc_hook, or the Global Offset Table (GOT). Other
techniques also target the stack which is a viable option if you can accurately
determine where the return address of the current function is located. After we
gain the ability to conduct an arbitrary write, gaining code execution should
be trivial with any other technique.
Requirements
An attacker using the Fastbin Dup must have these conditions present:
- Have chunks that are in the fastbin
- Have a UAF vulnerability with the ability to control the data written to the free chunk
- Have the ability to control the data written to the chunk that overlaps the
write target (
__free_hook, etc.) - Have a memory leak that allows the attacker to defeat ASLR if enabled
Patch
Unfortunately, the researchers at Checkpoint Research proposed protections
for the fd pointers used to implement the linked list data structures of the
fastbin and tcache. [2] To prevent attackers from leveraging the
Fastbin and Tcache Dup techniques, these researchers implemented the
PROTECT_PTR and REVEAL_PTR macros for the fd pointer of the fastbin and
tcache singly-linked lists.
Summarizing the implementation of these macros, the fd pointer of the fastbin
and tcache are mangled using the random bits of the virtual memory address
currently holding the fd pointer. The macro definitions are as follows
[3]:
#define PROTECT_PTR(pos, ptr) \
  ((__typeof (ptr)) ((((size_t) pos) >> 12) ^ ((size_t) ptr)))
#define REVEAL_PTR(ptr)  PROTECT_PTR (&ptr, ptr)
These mitigations make the Fastbin Dup technique significantly harder to pull
off. Now, in order to forge a fd pointer, the attacker has to leak
sensitive information from the process to derive the location of their
arbitrary write target in memory. They must use that same address to mangle
their forged fd pointer before writing it to the victim chunk. The final
nail in the coffin, however, is the fact that the pointer must be page-aligned.
This, coupled with checks done by glibc to verify the size field of our fake
chunk overlapping our write target, invalidates our ability to use the above
technique to overwrite something like the __malloc_hook to gain control of
the RIP.
References
- https://github.com/shellphish/how2heap/blob/master/glibc_2.31/fastbin_dup.c
- https://research.checkpoint.com/2020/safe-linking-eliminating-a-20-year-old-malloc-exploit-primitive/
- https://sourceware.org/git/?p=glibc.git;a=commitdiff;h=a1a486d70ebcc47a686ff5846875eacad0940e41
Unsortedbin Attack
The Unsortedbin Attack and the Use-after-free (UAF) vulnerability are loosely related enough for me to write about it in this section. The Unsortedbin Attack can be used if you have a heap overflow vulnerability, as shown in the House of Orange, however, for that version of the technique to work some special conditions need to be present. For the purpose of this discussion, we're only going to concern ourselves with the Unsortedbin Attack implemented with a Use-after-free (UAF) vulnerability.
How it works
This technique is actually pretty simple. To leverage this attack, the attacker needs to be able to:
- Acquire a chunk on the heap that is too large for the fastbin
- Acquire another chunk after the previously mentioned chunk that acts as a fencepost between the previously mentioned chunk and the top chunk.
- Free the first chunk.
- Edit the first chunk (UAF vulnerability).
- Execute another
malloc(), requesting a chunk of the same size as the one that wasfree()'d and linked into the Unsortedbin.
So what happens here?
The first chunk on the heap is too large for the fastbin so, when it is
free()'d, it is linked into the Unsortedbin. This free chunk will be linked
into a small or largebin, based upon its size, during the next call to
malloc(). We create a buffer chunk between this previously mentioned chunk
and the top chunk prior to trying to free the first chunk, otherwise our
victim chunk will be consolidated into the top chunk.
With our Use-after-free (UAF) vulnerability, we overwrite the bk pointer of
the chunk in the Unsortedbin to point to an address that we want to write to.
What are we writing? Well, when an Unsortedbin chunk is chosen to service a
malloc() call, the memory address of the main_arena that contains the head
of the Unsortedbin is written to where the bk points to.
How is this used for exploitation?
Honestly, the Unsortedbin Attack is often used to enable other techniques. It's usually a precursor to further exploitation but, by itself, it's not useful for gaining code execution.
A great example technique that leverage the Unsortedbin Attack to gain code
execution is the House of Orange. In that example,
however, the vulnerability leveraged to overwrite the bk of the chunk in the
Unsortedbin is a heap overflow.
Another good example is the zerostorage challenge from 0ctf 2016
. In this challenge, the attacker uses a UAF vulnerability to overwrite the
bk of a chunk in the Unsortedbin and then forces an allocation of this chunk
to overwrite the symbol libc.global_max_fast. global_max_fast represents
the largest size a fastbin chunk can be - overwriting it with the memory
address that contains the Unsortedbin head, making the size of fastbin chunks
almost arbitrarily large.
Using the above, the attacker now has the ability to create fastbin chunks and,
because a UAF vulnerability is present, the attacker can leverage the Fastbin
Dup to gain code execution, targeting the __free_hook.
Patch
The Unsortedbin Attack went unpatched until glibc 2.29, commited to the
glibc repo on 17 AUG 2018. Before the patch, no integrity checks were
conducted on the fake chunk pointed to by the corrupted bk pointer used in
this technique. Now, integrity checks are conducted on the free chunk being
inspected in the Unsortedbin, the next chunk of the victim free chunk, and
the chunk pointed to by bk. [2].
References
- https://guyinatuxedo.github.io/31-unsortedbin_attack/0ctf16_zerostorage/index.html
- https://sourceware.org/git/?p=glibc.git;a=commitdiff;h=b90ddd08f6dd688e651df9ee89ca3a69ff88cd0c
Heap grooming
Let's first define heap grooming by identifying that it's not heap spraying. While these two concepts are related, heap spraying is used to make other exploitation techniques more reliable. Heap spraying gained popularity starting in 2001, and is primarily used to store code in a reliable location when attempting to gain code execution. [1]
Heap grooming or heap feng shui or heap shaping is a more nuanced technique that attempts to shape the heap in a manner that allows for follow on exploitation by the attacker. The use of this technique is pivotal to improving the reliability of using heap memory corruption for exploitation. For example, in order to use a heap overflow to create the conditions for overlapping chunks or a Use-after-free (UAF) vulnerability, the attacker might want to have chunks of specific sizes in specific locations or have program data structures in advantageous locations for sensitive information leaks, etc.
Examples
Heap Feng Shui in Javascript
First, we'll start with this BlackHat talk by Alexander Sotirov. It's actually pretty awesome that something this intense was discussed as early as 2007. Alexander's talk begins with a description of heap spraying, but shows that, while heap spraying is useful, it's still unreliable - we need the heap to be in a deterministic state to achieve reliable exploitation.
His Heap Feng Shui portion of the talk discusses how the heap allocator is
deterministic in nature. The attacker must coerce the program to execute a
series of allocations and frees until he deterministically controls important
locations in the heap. Eventually, he demonstrates that the attacker can place
malicious bytes onto the heap in a repeated nature, coerce the program to free
his allocated chunks, and then, when the program resumes a different
subroutine and allocates the recently free()d chunks, the attacker can
exploit an unitialized variable vulnerability to gain code execution.
He goes on to discuss how the memory allocator works for Javascript / Internet Explorer and his creation of a library that allows him to log, debug, allocate, and free heap chunks of arbitrary size and contents within the Javascript / Internet Explorer heap.
Grooming the iOS Kernel Heap
Next, we'll talk about Azeria's discussion on grooming the iOS kernel heap. In this real world example, she demonstrates the exploitation of a one byte, heap overflow vulnerability to gain a UAF that allows her to leak sensitive information from program memory.
In this example, Azeria discusses that the state of the heap before
exploitation is fragmented, with free and allocated chunks sparsely strewn
about the heap. She coerces the application to fill the "gaps" in the heap by
allocating objects until the freelist is empty. Subsequent allocations will
then start at the highest address of the heap where she begins to create a
series of "exploit zones", comprised of victim objects and placeholder objects.
The victim objects will be used to overflow into succeeding objects on the
heap. She free()s all of the placeholder objects in quick succession, linking
them into the freelist. When the kernel allocates her target objects that she
wishes to overflow into, the new allocations will be adjacent to the victim
objects.
Using heap grooming, Azeria demonstrates that an attacker can coerce the allocator into placing victim objects next to sensitive kernel objects on the heap in order to corrupt heap memory, leading to a sensitive information disclosure.
Chrome OS exploit: one byte overflow and symlinks
shill, the Chrome OS network manager, had a one byte heap overflow in its
DNS library. Attackers could communicate with the library using an HTTP proxy
that was listening on localhost. The author demonstrates his use of
heap grooming to ensure that the memory layout of the vulnerable process
remained predictable so that he could reliably place allocations in the same
location in heap memory.
The author demonstrates that, upon each connection, four allocations are
conducted by the program to hold program data on the heap. When the connection
closes, however, the middle 0x820 bytes in these four allocations are
free()d and consolidated, and the two still allocated chunks protect the
free 0x820 chunk from being further consolidated or modified.
The author goes on to explain that, in order to continue to reliably use this
0x820 chunk of memory to obtain overlapping chunks, he has to coerce the
program to conduct "tons of small allocations" in order to empty the freelist.
Finally, subsequent allocations allow him to reliably use his 0x820 chunk of
memory, eventually conducting a heap buffer overflow to shrink a free chunk
causing a future free() operation on a succeeding chunk to overlap an
allocated chunk. [4]
Malloc tunables
A listing of malloc tunables can be found here. There's not
much documentation on how malloc tunables can affect exploitation methods,
or my Google-Fu is probably just not good enough. Either way, in this section
I'll wargame some malloc tunable changes that could possibly bring about
interesting changes to how we approach heap exploitation.
glibc.malloc.tcache_count and glibc.malloc.tache_max
These two tunables are interesting if we know that the target glibc uses
tcaches. If I knew that the vulnerable program was vulnerable to a double
free, I would probably go for a Fastbin Dup attack. The default number of
chunks that get linked into the tcache is 7, however, if this was modified
to be something else, we'd have to do some debugging in production conditions
to determine the tcache_count. This tunable would affect the number of chunks
I free() in order to fill the tcache before I attempt to abuse the fastbin.
tcache_max could also affect any attempts to go after heap metadata for
chunks linked into the unsortedbin. If tcache_max's size overlapped with
sizes that are usually used for the unsortedbin, I would have to ensure that
the tcache is full before attempting to link chunks into the unsortedbin.
glibc.malloc.arena_max and MALLOC_ARENA_MAX
The glibc.malloc.arena_max tunable overrides anything set by
MALLOC_ARENA_MAX, but they achieve the same outcome. These two tunables set
the maximum number of arenas that can be used by the process across all threads
. For 32-bit systems, this value is twice the number of cores online and for
64-bit systems, this value is 8 times the number of cores online.
This is important if we're attempting to exploit the heap of a vulnerable
program that leverages multi-threaded operations. MALLOC_ARENA_MAX increases
the number of available memory pools that threads can allocate memory from.
A higher number of arenas helps to prevent thread contention for heap
resources as each thread has to lock the arena before allocating or free()ing
memory.
If we have local access to the vulnerable application, we can modify the
MALLOC_ARENA_MAX environment variable and set it to 1. This forces each
thread of our target program to use the same arena, allowing us to possibly
exploit race conditions that might be present, or it could just make grooming
the heap easier. Either way, it's important to keep in mind how many arenas are
present when exploiting a program that leverages multi-threading as this will
guide our approach on how to effectively groom the heap across multiple arenas.
References
- https://seclists.org/bugtraq/2001/Jul/533
- https://www.blackhat.com/presentations/bh-europe-07/Sotirov/Presentation/bh-eu-07-sotirov-apr19.pdf
- https://azeria-labs.com/grooming-the-ios-kernel-heap/
- https://googleprojectzero.blogspot.com/2016/12/chrome-os-exploit-one-byte-overflow-and.html
- https://www.gnu.org/software/libc/manual/html_node/Memory-Allocation-Tunables.html
Race conditions
Before we explain how race conditions can be used for exploitation, let's first understand race conditions. Like with everything, there's a Common Weakness Enumeration (CWE) entry for this vulnerability. The formal name for a race condition is Concurrent Execution using Shared Resource with Improper Synchronization. What this essentially means is that the vulnerable program is leveraging parallelism, executing sections of code concurrently. Concurrent operations exist in just about every modern application as it's much more effecient than executing code sequentially and makes better use of available operating system resources.
The problem in this situation, as stated in the title, is that the use of resources across execution contexts is improperly synchronized. If you've dealt with multi-processing or multi-threading before, you'll understand the need to protect shared resources by enforcing atomicity and exclusivity. Two or more execution contexts accessing or modifying a shared resource without the proper use of synchronization mechanisms can lead to undefined behavior - and undefined behavior can lead to program exploitation.
In the following sections, we'll discuss a few vulnerabilities that are children of race conditions, with some examples on how they can be exploited.
Signal Handler Race Condition
Signal handler race conditions can occur when signal handlers registered for a process use non-reentrnant functions. Reentrancy is a property of a function or subroutine where multiple invocations can safely run concurrently. Reentrant functions can be interrupted in the middle of their execution and then safely re-entered before previous invocations complete execution.
Non-reentrant functions that are commonly involved with this vulnerability
include malloc() and free() because they may use global or static data
structures for managing memory. This vulnerability manifests when a procedure
used for signal handling is registered for multiple signals and accesses the
shared resources during the handling of the signal. Below is some example code
that demonstrates this vulnerability, written by Michal Zalewski in the article
, Delivering Signals for Fun and Profit:
/*********************************************************
 * This is a generic verbose signal handler - does some  *
 * logging and cleanup, probably calling other routines. *
 *********************************************************/

void sighndlr(int dummy) {
  syslog(LOG_NOTICE,user_dependent_data);
  // *** Initial cleanup code, calling the following somewhere:
  free(global_ptr2);
  free(global_ptr1);
  // *** 1 *** >> Additional clean-up code - unlink tmp files, etc <<
  exit(0);
}

  /**************************************************
   * This is a signal handler declaration somewhere *
   * at the beginning of main code.                 *
   **************************************************/

  signal(SIGHUP,sighndlr);
  signal(SIGTERM,sighndlr);

  // *** Other initialization routines, and global pointer
  // *** assignment somewhere in the code (we assume that
  // *** nnn is partially user-dependent, yyy does not have to be):

  global_ptr1=malloc(nnn);
  global_ptr2=malloc(yyy);

  // *** 2 *** >> further processing, allocated memory <<
  // *** 2 *** >> is filled with any data, etc...     <<
In this example, Michael discusses that this code is vulnerable because both
SIGHUP and SIGTERM's signal handlers execute syslog(), which uses
malloc(), and free() on the same shared resources. These functions are not
re-entrant because they operate on the same global structures, if one of the
signal handler functions were suspended while the other executed, it's possible
that, once global_ptr2 is free()d, syslog() could be executed with
attacker-supplied data, re-using the free chunk and overwriting heap metadata.
Given the right conditions, this could lead to process exploitation.
Race Condition within a Thread
This particular example is pretty straight-forward: two threads of execution in a program use a resource simultaneously without proper synchronization, possibly causing the threads to use invalid resources, leading to an undefined program state.
Below is some example C code from CWE demonstrating this vulnerability:
int foo = 0;
int storenum(int num) {
	static int counter = 0;
	counter++;
	if (num > foo) foo = num;
	return foo;
}
Again, pretty straight-foward. If this code executed concurrently using two
different threads, the value of foo after this procedure's returns is not
deterministic between different invocations of the program.
A more interesting and real-world example of this bug that achieves code execution is demonstrated in the article, Racing MIDI messages in Chrome, by Google Project Zero. Some background information: Chrome implements a user facing JavaScript API that conducts inter-process communication (IPC) with a privilieged browser process that provides brokered access to MIDI (Musical Instrument Digital Interface) devices. Yeah, it's a surprise to me, too.
Anyways, the author goes to describe two bugs he found in the MIDI manager's
implementation, both vulnerable to a use-after-free (UAF) bug due to a race
condition. Because concurrent operations on objects in the heap are not
properly synchronized between threads, it's possible to coerce one of threads
to execute a virtual function of an already free object in the heap. The author
goes on to provide a proof of concept to obtain code execution using the first
bug, leveraging heap grooming to obtain a desirable heap state before forcing a
series of allocations to overwrite the vtable of the free object.
Without an adequate sensitive information disclosure, he is unable to
predicatbly redirect the process to obtain arbitrary code execution, however,
he still demonstrates that he can gain control of the RIP.
Time-of-check Time-of-use (TOCTOU)
Time-of-check time-of-use (TOCTOU) is a classic vulnerability that is a child of the race condition weakness. In summation, the program checks the state of a resource, our permissions to access the resource, etc., before actually using it. The actual use of the resource comes after the check, but what if the state of the resource changes before it's used? If we check the resource but its properties change before we actually use it, our program is liable to have undefined behavior.
An interesting example of this vulnerability and how it can be exploited was
covered in the logrotate challenge of 35C3CTF 2019. In the
challenge, the logrotate binary rotates logs within the /tmp/log directory,
owned by the user. The logrotate program executes as root, but creates
files that are owned by user:user in the directory of /tmp/log. logrotate
executes stat() on the /tmp/log directory prior to using the directory
to write /tmp/log/pwnme.log, making logrotate vulnerable to a TOCTOU race
condition.
Armed with this information, the author of the writeup uses inotify to detect
when a change occurs for the /tmp/log directory. As soon as this happens, the
author creates a symbolic link for /tmp/log pointing it to
/etc/bash_completion.d. logrotate creates a user owned pwnme.log file
in /etc/bash_completion.d where the author writes his reverse-shell callback
shell script to. The next time root acquires a session, the reverse-shell
callback script is executed and the attacker is able to acquire a root shell.
The CTF challenge I just described is also a good example of the CWE: Symbolic Name not Mapping to Correct Object.
Conclusion
There are a few other vulnerabilities that are children of the general race condition CWE such as:
- Context Switching Race Condition
- Race Condition During Access to Alternate Channel
- Permission Race Condition During Resource Copy
While these are also interesting CWEs related to race conditions, the ones we discussed above have pretty solid examples and demonstrations of real-world application, which is the primary reason why I covered them.
References
- https://cwe.mitre.org/data/definitions/362.html
- https://cwe.mitre.org/data/definitions/364.html
- https://en.wikipedia.org/wiki/Reentrancy_(computing)
- https://lcamtuf.coredump.cx/signals.txt
- https://cwe.mitre.org/data/definitions/366.html
- https://googleprojectzero.blogspot.com/2016/02/racing-midi-messages-in-chrome.html
- https://cwe.mitre.org/data/definitions/367.html
- https://tech.feedyourhead.at/content/abusing-a-race-condition-in-logrotate-to-elevate-privileges
- https://cwe.mitre.org/data/definitions/386.html
- https://cwe.mitre.org/data/definitions/368.html
- https://cwe.mitre.org/data/definitions/421.html
Exploit primitives
In this section, you'll find my notes on common exploit primitives and how to implement them with different vulnerabilities. This section includes discussions on the following topics:
- Arbitrary write primitives
- Relative write primitives
- Arbitrary read primitives
- Chaining primitives to build an exploit
- Using write primitives to escalate privileges
Arbitrary write primitives
An arbitrary write primitive, formally known as a Write-what-where condition, is a condition where the attacker has the ability to write an arbitrary value to an arbitrary location. An attacker can implement this primitive by abusing an already existing vulnerability. Here are some examples:
Use of Externally-Controlled Format String
This isn't really an attacker implemented arbitrary write primitive as format
string vulnerabilities alone can allow attackers to write to arbitrary locations
, given the right circumstances. Essentially, the attacker is able to provide
a format string argument to the vulnerable program and this argument will be
used by functions like printf, sprintf, etc.
The issue here is that the format string identifiers n, hn, and hhn allow
the attacker to write the number of bytes written so far by the printf call
into an integer pointer parameter - n is an integer, hn is a short, and
hhn is a byte (char). The attacker can craft a format string to place their
write address(es) onto the stack, use format string identifiers like c and
x to write an arbitrary number of bytes to stdout, and then use n, hn,
or hhn with an offset (for example $7hn where 7 is the location of the
target address on the stack) to write arbitrary values to any writeable
location in program memory.
Out-of-bounds Write
As demonstrated in the House of Force,
a heap buffer overflow can be used by an attacker to implement an arbitrary
write primitive. The attacker leverages the heap buffer overflow to overwrite
the value of the top_chunk and tricks malloc into relocating the top chunk to
a location directly above the attacker's desired arbitrary write target.
Finally, the attacker coerces the program to execute another malloc call,
creating a chunk directly overlapping the arbitrary write target. From here,
the attacker can now modify the user data of the chunk, writing arbitrary data
to the arbitrary write target.
Use-after-free (UAF)
As we discussed in the Fastbin Dup, an attacker
can leverage a UAF to corrupt the heap metadata of a free chunk that has been
linked into the fastbin. The attacker overwrites the victim chunk's fd
pointer to point to a fake chunk that overlap's the attacker's desired
arbitrary write location. The attacker coerces the program to empty the fastbin
, eventually allowing the attacker to allocate a chunk that overlaps their
arbitrary write target. From here, the attacker can now modify the user data
of the chunk, writing arbitrary data to the arbitrary write target.
A UAF can also be leveraged to gain an arbitrary write by abusing malloc()'s
unlink()ing behavior. If the attacker has the ability to modify a chunk that
has been recently free()d and linked into the unsortedbin, the attacker can
corrupt the heap metadata of the victim unsortedbin chunk, specifically its
fd and bk pointers. The attacker overwrites the fd pointer of the victim
chunk to point to a fake chunk that overlaps the attacker's arbitrary write
location, and overwites the bk of the victim chunk to contain the arbitrary
data to be written to the arbitrary location. If the attacker can coerce
malloc() to consolidate the victim unsortedbin chunk with another free
chunk, the corrupted bk will be written to the fake chunk overlapping the
attacker's arbitrary write target. A couple of details regarding this method
have been left out, including mitigations that have been applied to prevent
this as well as how to gain code execution using this technique. More detail
is provided in the
Safe list unlinking discussion.
Free of Memory not on the Heap
This one is pretty interesting. Essentially, a free() call gets pointed to a
chunk that's not on the heap and, if nothing fails free()'s chunk checks,
the location in memory that was just free()d gets linked into one of the
arena's bins. I say this is particularly interesting because there could be
some scenario in which chunk pointers are contained in some data structure
located on either the stack or in global data, such as .data or .bss. If
the attacker were able to corrupt one of these pointers before it gets
free()d, the attacker could coerce free() into linking an arbitrary
location in memory into a bin. The attacker could then coerce the program to
call malloc() enough times until the attacker acquires a pointer to a chunk
overlapping their arbitrary write target. From here, the attacker could modify
the fake chunk's user data, overwriting their arbitrary write target.
References
- https://cwe.mitre.org/data/definitions/123.html
- https://cwe.mitre.org/data/definitions/134.html
- https://cwe.mitre.org/data/definitions/787.html
- House of Force
- https://cwe.mitre.org/data/definitions/416.html
- Fastbin Dup
- Safe list unlinking
- https://cwe.mitre.org/data/definitions/590.html
Relative write primitive
The relative write primitive does not have a formal Common Weakness Enumeration (CWE) Weakness ID, making it a bit harder to find great resources that adequately cover this primitive. Nonetheless, this is still a pretty powerful primitive and, under the right conditions, can lead to pretty reliable exploits.
Definition
A relative write primitive is a condition in which the attacker can control sensitive program information via a memory corruption vulnerability from a relative location to the targeted sensitive information. Basically, the attacker can expect that their target memory location for corruption is at a specific offset when providing data to the program. Given this definition, both stack buffer overflows and heap buffer overflows can qualify as relative write primitives.
In a stack buffer overflow, the attacker can expect that the
saved frame pointer and return address of a program stack frame will always
be in the same location. Thus, when they've determined the offset of the buffer
they're overflowing relative to their targeted write location, they can use
their relative write primitive to reliably corrupt a stack frame, providing the
attacker control over process execution. A good example of reliable
exploitation that uses a relative write primitive is the funge-and-games
CTF challenge from Cyberstakes 2017. The challenge allows us to provide a
Befunge program to the vulnerable binary, simulating operations that would be
executed by a Befunge interpreter. The vulnerability lies in the fact that no
bounds checking is conducted when the Befunge interpreter references its
internal stack data structures, allowing an attacker to conduct out-of-bounds
reads and writes. The attacker can use this to reliably corrupt the
return address of the program's stack frames using a relative write
primitive.
Likewise, a heap buffer overflow can be used by an attacker to achieve similar objectives. If the attacker is aware that sensitive program information is contained within the heap chunk that they are able to overflow into, they can use this intra-chunk heap overflow, or relative write primitive, to reliably corrupt the sensitive information contained within the current heap chunk. This bug class and its reliability is discussed further in this Google Project Zero article.
House of Roman
The House of Roman is a great example of using relative overwrites within the heap to gain code execution. This technique doesn't require a specific heap memory corruption vulnerability to exist, it could be either a heap overflow or use-after-free (UAF). The attacker just needs to be able to edit a couple of pointers contained within the user data and metadata of heap chunks , using heap feng shui to adequately groom the heap for deterministic relative writes.
The attacker grooms the heap to obtain a favorable state and then uses their
relative write primitive to obtain a fastbin chunk that overlaps the
__malloc_hook function pointer in glibc. This is possible because the
attacker abuses the nature of the unsortedbin to acquire glibc pointers in
the fd and bk pointers of a chunk, and then edits the last 4 bits of these
pointers to point to a fake chunk that overlaps the __malloc_hook.
The attacker is also able to get this fake chunk linked into the fastbin by
editing a preceding free chunk that is also in the fastbin, modifying the last
4 bits of the chunk's fd pointer to link the chunk that contains the address
of the __malloc_hook in to the fastbin. This is possible because, as we
mentioned earlier, the attacker uses heap feng shui to land target chunks at
specific offests. In this case, the chunk with glibc pointers is at an
offset of 0x100 from the preceding chunk mentioned.
The attacker conducts an unsortedbin attack to overwrite the __malloc_hook
with an address of main_arena. Again, only a couple of bytes are required to
be overwritten within the bk pointer of the unsortedbin chunk in order to
point the bk to __malloc_hook. Once the attacker writes a main_arena
address to the __malloc_hook, the attacker uses the previously mentioned
fastbin chunk that overlaps the __malloc_hook to edit the last couple of
bytes in the written information, overwriting the __malloc_hook with the
address of system() or a one_gadget.
Of note, due the amount of randomness introduced by ASLR, this technique is
only really successful if the attacker is able to brute force the location of
glibc data structures. If the program crashes after each attempt, the
likelihood of this technique working is pretty low. Despite all of this, the
House of Roman is a good technique to demonstrate the power of relative
write primitives and how they can be chained to gain code execution.
References
- https://googleprojectzero.blogspot.com/2015/06/what-is-good-memory-corruption.html
- https://github.com/shellphish/how2heap/blob/master/glibc_2.23/house_of_roman.c
Arbitrary read primitives
An arbitrary read primitive is a condition in which the attacker can read any location within a process's virtual memory. A close formal definition for this condition provided by the Common Weakness Enumeration (CWE) list is Untrusted Pointer Dereference. This definition describes a condition for a program in which it will dereference the value of any pointer provided, whether it be from a trusted or untrusted source. An attacker can find usefulness from this condition if the program prints the content of the pointer provided. Below are some examples of how an attacker can implement or utilize an arbitrary read primitive present within a program.
Use of Externally-Controlled Format String
Just like in our Arbitrary write primitives discussion, we note that a format string vulnerability is not a condition that is implemented by an attacker, it's just present due to programmer error. The condition itself, however, is still useful for an attacker to arbitrarily read memory from any location in the process, given the right conditions.
Like our previous discussion, the attacker can provide an address in their
forged format string in order to place that address onto the stack for their
vulnerable printf() call. Also like our previous discussion, the attacker
must know the offset of their placed address on the stack during the call to
printf(). Unlike our previous discussion, the attacker will have to use
different format string identifiers in order to print the contents of the
address they placed onto the stack. The most commonly used format string
identifiers used by attackers to dump information from memory are:
p-void*x-unsigned ints-null terminated string
Use of Out-of-range Pointer Offset
This particular condition is a child of Improper Restriction of Operations within the Bounds of a Memory Buffer, however, I feel like this is more applicable to this discussion about arbitrary read primitives. The most important portion of this condition's Extended Description is the statement:
If an attacker can control or influence the offset so that it points outside of the intended boundaries of the structure, then the attacker may be able to read or write to memory locations that are used elsewhere in the program.
For our discussion, we're interested in the implementation of an arbitrary read
primitive using the condition described above. A good example of implementing
an arbitrary read primitive is the feap challenge from
ASIS CTF Quals 2016. The arbitrary read primitive for this
challenge exists in the print_note function of the vulnerable executable. The
print_note function conducts no bounds checking when indexing into the
notes array, allowing the attacker to provide array indices that are outside
the bounds of the notes array. This ultimately leads to the program treating
these out of bounds locations as note structures, and attempts to call
printf() on what it believes to be a note's title attribute.
Coincidentally, the note_sizes array resides directly below the notes array
that the attacker is able to read past. The attacker is able to forge a valid
pointer in memory in the note_sizes array by creating a note of a particular
size: their target address - 0x40 (to account for the bytes added by the
program). The attacker then reads past the notes array and fools the program
into calling printf() on the valid memory address contained within
note_sizes - the program thinks this pointer offset is a valid note struct.
This condition in this CTF challenge provides the attacker the ability to
implement an arbitrary read primitive.
So what are arbitrary read primitives good for?
Attackers most commonly use arbitrary read primitives to leak sensitive
program information, allowing them to bypass mitigations such as ASLR, PIE,
stack canaries, and possibly even pointer mangling. If the attacker can conduct
an arbitrary read of data from the stack, they will most likely be able to
expose glibc and program pointers or return addresses stored on the stack,
allowing them to calculate the base addresses for the glibc and program
segments in the process's virtual memory mapping. Attackers would also have an
interest in leaking heap pointer information in order to derive the base of the
heap in memory, especially if their method of gaining code execution is via a
heap memory corruption vulnerability.
Conclusion
An arbitrary read primitive is only useful if an attacker knows what information they want and where to get it. Attackers must also know how to use an initial exposure to guide succeeding exposures - you won't always know the exact address of your arbitrary read target, and you might need to expose the contents of other data structures in memory in order to find it.
Take for example a vulnerable non-PIE binary where an attacker can implement an
arbitrary read primitive. The attacker doesn't know where the stack is, but
they do know the location of the Global Offset Table (GOT), allowing them to
leak glibc information for functions that have been called and their address
within glibc resolved - from here an attacker can now derive the base of
glibc in process memory. Now knowing the base of glibc in memory, if the
attacker wished to locate the base of the heap, they would be able to target
the main_arena in glibc. Using the main_arena, the attacker can leak the
location of one of the bins, allowing them the ability to derive the base of
the heap in memory. The usefulness of an arbitrary read primitive relies on
its user's understanding of the state of the process when the primitive is
implemented and the user's knowledge of where important data structures are
stored in process memory.
References
- https://cwe.mitre.org/data/definitions/822.html
- https://cwe.mitre.org/data/definitions/134.html
- Arbitrary write primitives
- https://cwe.mitre.org/data/definitions/823.html
- https://ctftime.org/task/2370
Chaining primitives
As stated in the previous discussion, an
attacker can acquire these primitives but in order for these primitives to be
useful, an attacker has to understand the implications and side-effects of using
these primitives. Some of the best examples for chaining these primitives to
build an exploit in the challenges directory of this repository are the
funge-and-games challenge from Cyberstakes 2017 and the feap challenge from
ASIS CTF Quals 2016.
In the funge-and-games challenge we use a relative read / write primitive on
the stack to leak __libc_start_main+231, a symbol that we can expect to
always be present in the stack if a target is compiled with glibc. It might
be a different offset of __libc_start_main across different versions of
glibc, but this is the subroutine called by _start of the ELF that then
calls main - a pretty important piece of the pie. Leaking this symbol from
the stack allows us to derive the base address of glibc in process memory,
and from here we derive the location of our one_gadget. We use our relative
write primitive to overwrite the return address of main's stack frame with
the address of _start. This provides us the ability to restart the program
from a clean state, and from here we can provide another payload to the
program. Finally, we use the same buffer indexing vulnerability to overwrite
the return address of simulate to our one_gadget, and when the program
exits the simulator we gain an interactive shell.
For the feap challenge, I've already discussed how the attacker implements an
arbitrary read primitive in [1]. What's important is that the
attacker utilizes the arbitrary read primitive to expose some sensitive and
important information for building the final exploit. The attacker exposes the
base address of the heap, using the previously mentioned arbitrary read
primitive to read a heap address contained within the .bss section of the
ELF. This is possible because the vulnerable ELF is not a position independent
executable (PIE), we can always expect the base of the .bss section to loaded
into the same location in virtual memory upon each invocation of the program.
Next, the attacker does the same to uncover puts@GOT (symbol contained within
the Global Offset Table (GOT)). This is important because the attacker needs to
derive the base address of glibc in virtual memory in order to calculate the
location of the system() symbol. The attacker reads puts@GOT because, as
stated earlier, the target ELF is not a PIE - the GOT will always be loaded
into the same location in virtual memory each time the program is invoked.
Finally, the attacker implements an arbitrary write primitive using
The House of Force to write the address of
system@glibc to free@GOT. The next time free@plt is called on a chunk in
the heap, the call will resolve to system and the memory of the chunk will be
passed as an argument to system. The attacker uses this to free() a chunk
containing "/bin/sh" in its user data, causing the program to execute
system("/bin/sh").
References
Escalating privileges
We've covered how an arbitrary write primitive can be used to escalate privileges or execute arbitrary code in a lot of these different discussions, the Houses covered in our heap exploitation section, for example. In all of these examples, once the attacker has all the information they need from previous sensitive information disclosures to build their final payload, these techniques usually conduct one final, important write to gain control of the vulnerable process in order to execute arbitrary code. In this section we'll list some interesting targets that attackers write to to gain control of the process. This list will not be all-encompassing as I'm sure there are plenty of other candidates that can be used to hijack the process, these are just ones that are more popular within the community.
Global Offset Table
The GOT is a common location for attackers to target given they have an arbitrary write primitive. Whenever a program calls functions from linked libraries, the GOT will be used by the program to either resolve the symbol or call the symbol stored there. Attackers will commonly overwrite a GOT entry with the symbol of a different function they want the program to call, usually ensuring that the next couple of call operations conducted by the program include the now corrupted GOT entry. While this is a common target for arbitrary writes to gain arbitrary code execution, keep in mind that full RELRO mitigates this tactic, resolving all entries within the GOT and setting it to read-only before the program starts. [2]
Partial RELRO
In order to complete our knowledge about the Relocation Read-Only (RELRO)
protection mechanism, Partial RELRO is a security mitigation where the
Global Offset Table is relocated to reside above the .bss section. There
existed previous methods of attacking the GOT where attackers would utilize
a buffer overflow of a global variable contained in the .bss section to
corrupt the GOT - for some reason the .bss used to reside above the GOT
in ELF programs.
Compilers now enforce Partial RELRO by default, placing the GOT above the
.bss in order to mitigate this attack surface. [7]
initial@glibc
This write target is pretty cool. The initial data structure in glibc is
a read/writeable segment in memory that is used to contain/register sensitive
information that glibc tracks for the current process. For an attacker, the
more interesting information they would most likely go after are the function
pointers registered by atexit(). My understanding of this data structure and
its use to gain control of the process is derived from 0x00 CTF 2017's
challenge, "Left". [3] In the Left challenge, the program
gives the attacker a glibc leak, one arbitrary read and one arbitrary write
and then calls exit immediately after. The attacker must use this arbitrary
read to leak the mangled pointer of _dl_fini stored in the initial section
of glibc. _dl_fini is a function pointer that is always registered in the
initial section of glibc, and all of the function pointers stored in
initial are unmangled and executed when exit is called. The attacker uses
the exposed, mangled pointer of _dl_fini to derive the secret stored in
Thread Local Storage (TLS) and then mangles a one_gadget address in the
correct manner to forge a valid initial entry. The attacker then uses a
single arbitrary write to overwrite the _dl_fini pointer in initial. Once
the program calls exit, the one_gadget entry in initial will be executed,
allowing the attacker to gain an interactive shell.
_IO_list_all@glibc
This is an interesting one as well, and its usefulness is showcased in
The House of Orange. In The
House of Orange, the attacker uses the write primitive provided by an
Unsortedbin Attack to write a main_arena address to the _IO_list_all symbol
in glibc. This symbol keeps track of all the open _IO_FILE structures for
the process, and the attacker uses this to kick off some File Stream Oriented
Programming to gain control of the process for arbitrary code execution.
[5] The attacker forces the process to experience a SIGABRT
rasied by checks in malloc() which leads to glibc attempting to call the
overflow function of all _IO_FILE structures present in the linked list of
_IO_list_all. Because _IO_list_all now points to the main_arena, it
attempts to treat the main_arena as an _IO_FILE structure and attempts to
execute the overflow function registered in its vtable. This obviously fails
but, instead of failing completely, glibc just moves onto the next _IO_FILE
structure pointed to by main_arena's chain attribute (since glibc assumes
main_arena is an _IO_FILE structure at this point). It just so happens that
this chain attribute points to the smallbin, a location where the attacker
controls the data. Using this, the attacker ensures that a fake, but valid,
_IO_FILE structure resides in this location and fools glibc into calling
overflow from its forged vtable. The attacker ensures that overflow just
ends up being a pointer to system@glibc, and the argument being passed to
this call is the current _IO_FILE struct. The attacker ensures that
"/bin/sh" resides at the first word of bytes in the _IO_FILE struct, thus
fooling the process into executing system("/bin/sh").
__malloc_hook@glibc and __free_hook@glibc
And, finally, we have our usual suspects, the __malloc_hook and the
__free_hook. These are kinda the easy button of arbitrary write targets
within glibc if we know that our target program is making calls to malloc
and free in the future. As discussed in
The House of Force, the
__malloc_hook and the __free_hook are symbols in glibc that were
originally implemented to allow programmers the ability to register functions
that will be executed when calls malloc() or free() are made. The thought
process was to allow programmers the ability to gather memory usage statistics
or to install their own versions of these functions, etc.
Attackers use these hooks to redirect program execution with just one arbitrary
write, and they usually overwrite these locations with the address of a
one_gadget or the symbol of system(). It's not outside the realm of
possibility, however, that they could use these hooks to pivot to the location
of a ROP chain which could possibly lead to the execution of more complex
shellcode.
Honorable mention: _dl_open_hook@glibc
I won't go into too much detail with this one seeing as we've covered so many
other options already, but I recently just learned about this technique which
surprisingly doesn't have a lot of coverage on the internet. In
POCORGTFO 2018 [6], an author covers what they call the
"House of Fun", a frontlink attack in malloc() that people assumed was
mitigated but actually went unpatched until glibc 2.30. With the arbitrary
write that they gain through this technique, the attackers target
_dl_open_hook which is a hook where programmers can register a function
pointer to be called when dlopen() is called by the program. A little known
fact is that malloc_printerr when causes a SIGABRT and the program attempts
to dump the memory mapping of the process, it needs to call dlopen on
libgcc_s.so.1 in order to access the __backtrace function. With this in
mind, the attackers write a one_gadget to _dl_open_hook->dlopen_mode and
force malloc() to encounter corrupted heap metadata, causing it to call
malloc_printerr which leads to dlopen() which leads to the program
executing sys_execve("/bin/sh").
Conclusion
As we can see, viable write targets to gain arbitrary code execution within a process are aplenty. It's up to the attacker to ensure they understand what conditions need to be present in order to get reliable code execution - there's also some creativity required.
References
- The House of Force
- https://ctf101.org/binary-exploitation/relocation-read-only/
- https://ctftime.org/writeup/8385
- The House of Orange
- https://ctf-wiki.github.io/ctf-wiki/pwn/linux/io_file/fsop/
- https://www.alchemistowl.org/pocorgtfo/pocorgtfo18.pdf
- https://ctf101.org/binary-exploitation/relocation-read-only/
Return oriented programming
In this section, you'll find my notes on return oriented programming (ROP) and how to leverage the technique for exploit development. This section includes discussions on the following topics:
- Using ROP/JOP to overcome ASLR/NX
- Finding gadgets
- Calling libc functions / syscalls
- Chaining gadgets to execute code
- Using ROP/JOP to execute arbitrary shellcode
Overcoming ASLR/NX
What is ROP?
The below explanation is tailored towards x86 return-oriented programming. For amd64, the register names would change from E%%->R%% and word size would be 8 bytes instead of 4.
In a normal program, machine instructions are located within the .text
segment of the process's memory. Each instruction is a pattern of bytes to be
interpreted by the processor to change the program's state. The instruction
pointer, EIP, governs the sequential flow of a program, pointing to the
instruction that is to be fetched next and advanced by the processor after
each instruction is executed.
A return-oriented program is a particular layout of the stack segment within
a process - the stack segment being the location within the process's
memory that is pointed to by the ESP (more on this later in stack pivoting).
Return-oriented instructions are words on the stack that point to an
instruction sequence within the process's memory. In return-oriented
programming, the stack pointer, ESP, now governs the control flow of the
program and points to the next instruction sequence that will be fetched and
executed.
The execution of return-oriented programs is as follows:
- The word on the
stackthat theESPpoints to is read and used as the new value for theEIP. - The
ESPis incremented by 4 bytes, pointing to the next word on the stack. - The processor completes execution of the instruction sequence and, if the
provided instruction sequence was a
ROPgadget, aretwould be executed to repeat this process.
In contrast to normal programs, the ret instruction at the end of each
instruction sequence pointed to on the stack induces fetch-and-decode
behavior.
What is JOP?
With the popularity of ROP, some work has been done to protect against or
mitigate attacks that leverage ROP to deliver malicious payloads and gain
code execution. Proposed defenses include detection of consecutive ret
instructions that are suspected ROP gadgets [2], detection of
ROP-inherent behaviors like continuously popping return addresses that always
point to the same memory space [3], and the elimination of all
ret instructions within a program to remove return-oriented gadgets
[4].
Unlike ROP, Jump-oriented programming (JOP) does not rely upon the stack
or ret instructions for gadget discovery and gadget chaining. Like ROP,
JOP finds its gadgets within executable code snippets within the target
binary or in the standard C library, however, JOP gadgets end with an
indirect jmp instruction. To chain gadgets together, JOP specifies two
types of gadgets: the dispatcher gadget and functional gadgets.
In ROP, gadgets are stored on the stack and the ESP acts as the program
counter for a return-oriented program. In JOP, the program counter is any
register that points into the dispatch table, and control flow is dictated by
the dispatcher gadget that executes the sequence of gadgets within the
dispatch table. Each entry within the dispatch table points to a
functional gadget. In the corpus of gadgets derived from the code contained
within a target binary or shared library, the dispatcher gadget is comprised
of jump-oriented gadgets that advance the program counter within the dispatch
table and incorporate the least frequently used registers. This is done to
avoid having the program counter register subjected to side effects of
instructions in functional gadgets.
Functional gadgets within jump-oriented programming are useful instructions
ending in a sequence that will load the instruction pointer with the result of
a known expression. The primary requirement for functional gadgets is that,
by the time the gadget's jmp % instruction is executed, the jmp must
evaluate to the address of the dispatcher gadget or to another gadget that
leads to the dispatcher. Sequences that end in a call instruction are also
viable candidates for jump-oriented gadgets.
So how do we gain control flow?
Let's assume we've exploited some vulnerability within a target binary to gain
control of the EIP. While ROP only requires control over the EIP and the
ESP, JOP requires control over the EIP and any memory locations or
registers necessary to run the dispatcher gadget. To do this, an
initializer gadget is used to fill the relevant registers before jumping to
the dispatcher gadget.
Why would I use JOP over ROP?
As stated earlier, defenses have been proposed to detect ROP behavior within
a compromised binary. JOP's lack of reliance on the stack and use of jmp
and call instructions for control flow make it much harder to detect and
create identifiers for. If it is known that your target implements some sort of
protection mechanism to thwart ROP, JOP is still an option to gain control
over a target and execute code.
Does a ROP/JOP gadget have to be specifically from the .text segment of a binary? What are the characteristics of a usable gadget?
"[A] gadget is an arrangement of words on the stack, both pointers to instruction sequences and immediate data words, that when invoked accomplishes some well-defined task." [1]
The above quote suggests that ROP gadgets can be interpreted as a grouping of
words including one or more instruction sequences and immediate values that
encode a logical unit. Gadgets can be built from short instruction sequences
within target binaries, but they also can be derived from libraries used by
target binaries - a commonly used library being the standard C library.
ROP gadgets must be constructed so that when the ret instruction in the
instruction sequence is executed, ESP points to the next gadget to be
executed. The instruction sequences pointed to by gadgets must also reside
within executable segments of memory.
The characteristics of usable JOP gadgets are described in the previous
section: "What is JOP?"
What kind of primitive(s) and condition(s) might allow you to bypass ASLR via ROP/JOP on a non-PIE binary?
Untrusted Pointer Dereferences, Out-of-bounds Reads, Buffer Over-reads and
similar conditions that provide arbitrary or relative read primitives can be
used in a ROP/JOP attack to bypass ASLR. An attacker would aim to expose
a libc address to calculate the base of libc within the mapping of the
target's memory.
For a non-PIE binary, an attacker could also construct a ROP gadget that
would return into the .plt section to execute some libc function like
printf or puts. The target of this printf or puts call would be an
entry within .got.plt for a libc function that has already been resolved
by the linker. This would expose the address of the target libc function to
the attacker, allowing the attacker to calculate the base of libc within the
target's memory. This method works on non-PIE binaries because the .plt
section will be defined at some static address.
Can the PLT be used to call libc functions even when PIE is enabled? What primitive(s) and condition(s) might be required?
With PIE enabled, we must find some way to expose a program address to
calculate the base of the program loaded into the process's memory. This allows
us to calculate the location of the .plt section of the program within
memory. The same conditions as in the previous bullet are necessary; Untrusted
Pointer Dereferences, Out-of-bounds Reads, Buffer Over-reads and similar
conditions that provide arbitrary or relative read primitives can be used to
expose sensitive information required to build an exploit.
How does ROP/JOP evade NX/W^X?
NX, DEP, or the concept of W^X were created in order to combat conventional code injection techniques that usually executed code directly from the stack. Attackers found a way around this by using code that was already present within memory and marked executable, thus inventing return-oriented programming and jump-oriented programming.
A sufficient set of ROP/JOP gadgets provides Turing complete functionality
to the attacker, evading the W^X protection mechanism that is designed to
prevent arbitrary code execution.
References
- https://hovav.net/ucsd/dist/rop.pdf
- http://www.cs.jhu.edu/~sdoshi/jhuisi650/papers/spimacs/SPIMACS_CD/stc/p49.pdf
- https://link.springer.com/chapter/10.1007%2F978-3-642-10772-6_13
- https://www.csc2.ncsu.edu/faculty/xjiang4/pubs/ASIACCS11.pdf
Finding gadgets
What methods have been used to find ROP/JOP gadgets?
It is known that ROP gadgets must end in a ret instruction. This allows us
to search through a target binary or shared library to find our useful
instruction sequences that will comprise our gadgets. Luckily for us, in both
the x86 and amd64 architectures, instructions are variable-length and
unaligned. This means that we can use both intended and unintended instruction
sequences found within our targets, increasing the collection of available
gadgets.
A primary method presented in Hovav Shacham's paper is to find ret
instructions and scan backwards, using an algorithm that uses each ret
instruction as the root node of a tree and determining if the preceding bytes
represent valid instructions. Each child node of the tree is a valid gadget,
and the algorithm recursively explores the bytes preceding each child to
determine if they are also valid gadgets that can be added to the tree - up to
the maximum length of a valid x86 instruction.
Hovav contrasts this with finding ROP gadgets for SPARC targets. We cannot
use unintended instruction sequences to represent ROP gadgets because SPARC
enforces alignment on instruction read.
[4] This essentially reinforces the
point that an attacker must understand the specifics of the particular
architecture they are attacking when condcuting ROP.
Finding JOP gadgets follows a similar technique. A linear search can be
conducted to find the valid starting bytes for an indirect branch instruction:
0xff. This byte is usually followed by a second byte with a specified range
of values. In the same manner as ROP, a search is conducted backwards to
discover valid instructions that will comprise the gadget.
In Xuxian Jiang's paper, a series of algorithms are utilized to find gadgets,
deteremine if a gadget is viable for use, and to filter gadgets based upon a
set of heuristics - separating the gadgets into groups that can be used for
the dispatcher gadget and functional gadgets.
[5]
What constraints on the gadget-searching problem are added or removed by searching for gadgets in RISC architectures (like ARM or MIPS) instead of x86/amd64?
For x86/amd64 architectures, instructions are variable-length and
unaligned. This means that we can consider both intentional and unintentional
instructions for ROP gadgets. An unintentional instruction meaning we are
jumping into the middle of intentional instructions.
In contrast, SPARC, MIPS, and ARM enforce word alignment for
instructions - this rules out the possibility of deriving our gadgets from
unintentional instructions.
What are some common tools used to find ROP/JOP gadgets?
The most popular tools used to discover ROP gadgets are ROPgadget and
ropper. The links to these tools can be found in the
References section. [1], [2]
The pwntools CTF framework and exploit development library also provides
a ROP module that can find ROP gadgets and create ROP chains.
[3]
How might you implement a similar tool yourself (high-level overview)?
A similar tool that could be implemented quickly would follow some of these steps:
- User specifies the instruction to search for.
- Dump the target binary or shared library into hex (using something like
xxd). - Use a regular expression to search for the opcode that represents
ret:0xc3. - Using the data returned from the results of this search, use another regular expression to search for the opcode representing the specific instruction requested by the user.
- Return the line number that contains the gadget we found to the user.
A quick and dirty command line method to find a gadget sequence can be found
in this blog on ROP.
References
- https://github.com/JonathanSalwan/ROPgadget
- https://github.com/sashs/Ropper
- https://docs.pwntools.com/en/stable/rop/rop.html
- https://hovav.net/ucsd/dist/rop.pdf
- https://www.csc2.ncsu.edu/faculty/xjiang4/pubs/ASIACCS11.pdf
- https://crypto.stanford.edu/~blynn/rop/
Calling libc functions / syscalls
Calling conventions
First, let's talk about calling conventions. For the System V x86
application binary interface (ABI), parameters to functions are passed on the
stack in reverse order such that the first parameter is the last value pushed
to the stack.
Functions are called using the call instruction, pushing the address of the
next instruction onto the stack and jumping to the operand. Functions return
to the caller using ret, popping a value from the stack and jumping to it.
Function calls preserve the registers ebx, esi, edi, ebp, and esp.
eax, ecx, and edx are scratch registers, their values might not be the
same after a function call. The return value of a function is stored in eax,
unless the return value is a 64-bit value, then the higher 32-bits will be
returned in edx.
For the System V x86-64 ABI, parameters to functions are passed in the
registers rdi, rsi, rdx, rcx, r8, and r9. If a function call
requires more than 6 parameters, further values are passed to the function
call on the stack in reverse order. Functions return to the caller using ret,
popping a value from the stack and jumping to it.
Function calls preserve the registers rbx, rsp, rbp, r12, r13, r14,
and r15. rax, rdi, rsi, rdx, rcx, r8, r9, r10, and r11 are
scratch registers, their values might not be the same after a function call.
The return value of a function is stored in rax, unless the return value is a
128-bit value, then the higher 64-bits will be returned in rdx.
[1]
The standard C library and syscalls
What's a libc function?
The term libc is shorthand for the "standard C library". The most widely used
C library on Linux is the GNU C Library,
referred to as glibc. The pathname for your installation of libc on a
Linux operating system is probably something similar to: /lib/libc.so.6. For
a dynamically-linked target binary, you can use ldd to print its shared
object dependencies - you'll usually find libc.so.6 there.
[2]
libc functions are functions exported by the libc.so.6 shared library.
libc functions are commonly used functions within the C programming
language, for example: printf(), puts(), gets()
What's a syscall?
A system call (syscall), sometimes called kernel calls, is a request for
service that a program makes of the kernel. This is usually a privileged
operation, like changing permissions of a file, opening a file descriptor, etc.
The libc functions mentioned earlier usually handle syscalls for the
programmer, however, an attacker sometimes has to make syscalls directly for
an exploit to work. [3]
To make a syscall directly on x86 on a Linux operating system, first
ensure your registers contain their necessary values.
[4] Then, issue the instruction int 0x80. This instruction is
an interrupt that passes control to interrupt vector 0x80. On Linux, this
interrupt vector is used to handle syscalls. [5]
To make a syscall directly on x86-64 on a Linux operating system, first
ensure your registers contain their necessary values.
[6] Then, issue the instruction syscall. [7]
Using ROP to call a libc function
Now that we understand the calling conventions, we can use ROP to call libc
functions. We're going to assume that the attacker already has control over the
stack and the EIP or RIP. We're also going to assume that the attacker
has used an information leak to expose sensitive information, namely the base
of libc within memory. With these conditions, the attacker can execute one of
the most basic ROP attacks: ret2libc.
The attacker must use their control over the EIP/RIP and stack to
construct a stack frame that will call libc's system() function. The
attacker will also craft the stack frame so that the system() function will
use the string '/bin/sh' as an argument.
Here's what the stack would look like for a ret2libc attack on x86:
p32(system)         # Address of system() function within libc
p32(0xcafebabe)     # Fake return pointer
p32(bin_sh_ptr)     # arg0: pointer to '/bin/sh' string
After the stack is corrupted with the attacker's ret2libc stack frame,
when the vulnerable function conducts a ret, the program will pop the
system() address from the stack and jump to system() within libc. The
system() function will continue execution and use the pointer to the
'/bin/sh' string as an argument, executing system('/bin/sh').
For x86-64, remember that we need to place our arguments into registers
before making calls to libc functions. A ret2libc attack will look slightly
different:
p64(pop_rdi_ret)    # pop rdi; ret gadget
p64(bin_sh_ptr)     # arg0: pointer to '/bin/sh' string
p64(system)         # Address of system() function within libc
For x86-64, system() expects arg0 to be contained within the rdi
register. Using our techniques discussed earlier to find ROP gadgets, we
find a pop rdi; ret gadget within either libc or the target binary. We use
this gadget to pop the address of our '/bin/sh' string into rdi and then
we ret into the address of system(). Just like in x86, this executes
system('/bin/sh').
The next section will cover executing syscalls directly.
References
- https://wiki.osdev.org/System_V_ABI
- https://man7.org/linux/man-pages//man7/libc.7.html
- https://www.gnu.org/software/libc/manual/html_node/System-Calls.html
- https://web.archive.org/web/20200218024630/https://syscalls.kernelgrok.com/
- https://en.wikipedia.org/wiki/Interrupt_vector_table
- https://blog.rchapman.org/posts/Linux_System_Call_Table_for_x86_64/
- https://www.cs.fsu.edu/~langley/CNT5605/2017-Summer/assembly-example/assembly.html
Chaining gadgets to execute code
Creating a ROP chain on x86
Cool, so now we know how to call one libc function, let's call multiple.
Let's assume I have a file I want to read the contents of and the name of the
file is already within memory. I have full control of the stack and the
EIP/RIP. We crafted a stack frame to call system() with the argument
'/bin/sh' in the previous section. How do we craft a stack frame that calls
open() to open a file descriptor with our target file, read() to read the
data within the file into memory, and then write() to write the data to
stdout?
Again, we assume that the attacker has used an information leak to expose
sensitive information allowing them to discover the base of libc in memory.
The attacker also knows the location of the filename_ptr in memory.
Here's an example stack frame to accomplish this in x86:
p32(open_sym)           # address of open() function within libc
p32(pop_pop_pop_ret)    # pop %; pop %; pop %; ret gadget
p32(filename_ptr)       # arg0: pointer to filename string
p32(0x0)                # arg1: O_RDONLY
p32(0x0)                # arg2: 0 for mode
p32(read_sym)           # address of read() function within libc
p32(pop_pop_pop_ret)    # pop %; pop %; pop %; ret gadget
p32(0x3)                # arg0: assume fd of the target is 3
p32(initial)            # arg1: initial data structure in libc (rw-)
p32(1024)               # arg2: num of bytes to read from fd 3
p32(write_sym)          # address of write() function within libc
p32(pop_pop_pop_ret)    # pop %; pop %; pop %; ret gadget
p32(0x1)                # arg0: fd 1 (stdout)
p32(initial)            # arg1: initial data structure with our file content
p32(1024)               # arg2: num of bytes to write to fd 1 (stdout)
p32(exit_sym)           # address of exit() function within libc
So what's happening in this stack frame?
When the attacker overwrites the stack frame of the vulnerable function with
the code in this example, the vulnerable function will ret into our first
function call: open(). open() is going to use the filename_ptr for its
first argument (const char *pathname), 0x0 (O_RDONLY) for its second
argument (int flags), and 0x0 for its third argument (mode_t mode).
If the open() function is successful, eax will contain the file descriptor
of the now open file pointed to by filename_ptr - in this example we're
assuming the file descriptor is 3. Next, we use a pop %; pop %; pop %; ret
gadget to pop our arguments to open() off of the stack. The operand for
these pop % instructions doesn't really matter, so long as it's not ESP.
The pop %; pop %; pop %; ret gadget will now ret into our read() address
on the stack, poping the word off of the stack and executing libc's
read() function. read() is going to use 0x3 for its first argument
(int fd), initial for its second argument (void* buf), and 1024 for
its third argument (size_t count). If the read() function is successful,
eax will contain the number of bytes read from the file. We ret into our
gadget to pop all of read()'s arguments off the stack, then we ret
into our write() call.
write() is going to use 0x1 (stdout) for its first argument (int fd),
initial for its second argument (const void *buf), and 1024 for its third
argument (size_t count). If the write() function is successful, eax will
contain the number of bytes that was written to stdout. We ret into our
gadget and pop all of write's arguments off the stack, then we ret into
our exit() call.
Can you explain in greater detail why pop %; pop %; ret-esque gadgets are needed for building ROP chains on x86?
If we didn't use a pop %; pop %; pop %; ret gadget to clear our function
arguments off of the stack, the stack frame would look something like this:
p32(open_sym)
p32(read_sym)
p32(filename_ptr)
p32(0x0)
p32(0x0)
So what's the problem here?
When open() finishes, we'll ret into our read() call. This isn't going
to work out well for us though because read()'s arguments don't make any
sense now. Our first argument for read() points to a null byte, which isn't
a filename_ptr.
It's necessary for us to use pop %; pop %; pop %; ret gadgets in order to
clear the previous function call's arguments from the stack. These gadgets
allow us to effectively chain multiple function calls. [1]
Creating a ROP chain on x86-64
Let's do the same open(), read(), write(), exit() ROP chain on
x86-64:
p64(pop_rdi_ret)            # load filename_ptr into rdi
p64(filename_ptr)           # arg0: pointer to filename string
p64(pop_rsi_pop_r15_ret)    # load flags into rsi
p64(0x0)                    # arg1: O_RDONLY
p64(0xcafebabe)             # dummy bytes loaded into r15
p64(pop_rdx_ret)            # load mode into rdx
p64(0x0)                    # arg2: 0 for mode
p64(open_sym)               # address of open() function within libc
p64(pop_rdi_ret)            # load fd into rdi
p64(0x3)                    # arg0: assume fd of the target is 3
p64(pop_rsi_pop_r15_ret)    # load initial into rsi
p64(initial)                # arg1: initial data structure in libc (rw-)
p64(0xcafebabe)             # dummy bytes loaded into r15
p64(pop_rdx_ret)            # load num of bytes to read into rdx
p64(1024)                   # arg2: num of bytes to read from fd 3
p64(read_sym)               # address of read() function within libc
p64(pop_rdi_ret)            # load fd 1 (stdout) into rdi
p64(0x1)                    # arg0: fd 1(stdout)
p64(pop_rsi_pop_r15_ret)    # load initial into rsi
p64(initial)                # arg1: initial data structure with file content
p64(0xcafebabe)             # dummy bytes loaded into r15
p64(pop_rdx_ret)            # load num of bytes to write into rdx
p64(1024)                   # arg2: num of bytes to write to fd 1 (stdout)
p64(write_sym)              # address of write() function within libc
p64(exit_sym)               # address of exit() function within libc
So what's happening in this stack frame?
The operations that take place within this stack frame are exactly the same
as what took place in the x86 example, we're just using ROP gadgets to
ensure that we're following the x86-64 calling convention. Each pop %; ret
gadget is poping our arguments from the stack into the correct registers
for each libc function call. You can see that not everything is perfect,
though. The pop rsi; pop r15; ret gadget is poping a dummy value from the
stack into r15. We're not always going to find the perfect gadget to
pop % just one value into our target register - we have to make due with
what's available.
Creating a ROP chain to execute syscalls on x86 and x86-64
Alright, so now that we understand how to chain gadgets to make multiple libc
calls, here are some examples of ROP chains that execute syscalls in x86
and x86-64.
Here's an example ROP chain that executes
sys_open(filename_ptr, O_RDONLY, 0) in x86:
p32(pop_ebx_ret)    # load filename_ptr into ebx
p32(filename_ptr)   # arg0: pointer to filename string
p32(pop_ecx_ret)    # load flags into ecx
p32(0x0)            # arg1: O_RDONLY
p32(pop_edx_ret)    # load mode into edx
p32(0x0)            # arg2: 0 for mode
p32(pop_eax_ret)    # load syscall number into eax
p32(0x5)            # syscall number for sys_open
p32(int_80_ret)     # int 0x80; ret gadget
Here's an example ROP chain that executes
sys_open(filename_ptr, O_RDONLY, 0) in x86-64:
p64(pop_rdi_ret)    # load filename_ptr into rdi
p64(filename_ptr)   # arg0: pointer to filename string
p64(pop_rsi_ret)    # load flags into rsi
p64(0x0)            # arg1: O_RDONLY
p64(pop_rdx_ret)    # load mode into rdx
p32(0x0)            # arg2: 0 for mode
p32(pop_rax_ret)    # load syscall number into rax
p64(0x2)            # syscall number for sys_open
p64(syscall)        # syscall; ret
As you've probably noticed these two ROP chains seem super simple and super
similiar, but it won't always be that way. As I said earlier, creating a ROP
chain is a test of creativity, and you won't always be able to load your
registers with simple pop %; ret gadgets.
How might one combine multiple gadgets into one register-populating pseudo-gadget? What are some useful non-pop instructions for doing this in amd64?
You can definitely find gadgets that will pop all of your necessary arguments
into their respective registers. If we found something like:
pop rdi; pop rsi; pop rdx; ret in code, we could use this gadget before
making our read(), write(), and open() calls. [2]
In x86, there's an interesting instruction called popa/popad that pops
data into all general-purpose registers. This is definitely useful if you need
to intialize all of your registers prior to executing further code.
[3]
So what if I can't find a pop instruction for my target register?
If you can't find a pop instruction to directly load a register, you still
might have some options if you use xor and xchg.
The concept in using xor to load a register is as follows [2]:
xoryour target register against itself to zero it out.popthe data you want to load into a different register.xoryour target register against the other register, duplicating the data into your target register.
The concept in using xchg to load a register is as follows
[2]:
popthe data you want to load into a different register.- execute an
xchgwith your target register and the register containing your data.
Using the xchg method will swap the data between the two registers. Ensure
you reload the register you used to execute xchg if you intend to use it
later.
The mov %, %; ret gadget is also a viable method to load target registers.
Generating ROP chains to create exploits is just a test of the exploiter's
creativity.
Under what conditions would one need to stack pivot? What are some locations an attacker could store a second-stage chain for use in a stack pivot?
These ROP chains can get pretty long, sometimes we might not be able to write
more than a handful of words to the stack. In these conditions, we'll have to
conduct a stack pivot.
A stack pivot is a technique that relocates the stack to some other
location in memory. This allows us to completely control the contents of the
stack, and this is where we can place more words for our ROP chain. When
we pivot the stack to our new location, we can continue executing our ROP
chain without any of the pesky restrictions we faced on the original stack.
In order to pivot the stack, we pop the location containing the rest of
our ROP chain into the ESP/RSP register. Then, when our pop rsp; ret
gadget executes ret, the stack will be pointing to the location in memory
containing our second stage ROP chain.
An attacker could place a second stage ROP chain in any know read/writeable
location in memory. These locations could include the heap, the stack, a
buffer in .bss or .data, or (my personal favorite) libc's initial data
structure. [2]
I'm not familiar with the initial libc structure, can you explain what it is?
initial is a data section within libc that is read/writeable. If you know
the base of libc within memory and you know the version of libc being used
by a target program, you can determine the location of libc's initial data
structure within memory. It's a useful location to store file data that's been
read into memory, or second-stage ROP chains because the data strucuture is
usually empty.
The initial data structure is used by the libc function atexit() to store
a list of function pointers that will be called when exit() is called. In the
Left challenge from 0x00 CTF 2017, the initial data structure plays a
role in gaining control of the RIP.
Function pointers within initial are xord with some secret in thread-local
storage (TLS) and then rotated left 17 bits. In the Left challenge the
attacker needs to expose an entry within initial, derive the secret from the
entry, and then replace the entry in initial with a one_gadget. Then, when
exit() is called, the one_gadget is executed. This technique was
necessary because the target program had Full RELRO protections enabled,
preventing the attacker from overwriting a .got.plt entry.
[4]
All that being said, yes if you know the location of .data or .bss within
the program it's just as easy to write your second-stage ROP chain there.
However, if the program has the PIE protection mechanism enabled and you
don't feel like deriving the base of the program within memory, initial is
another read/writeable location that can be easily derived from the base of
libc. Use this location at your own discretion though, especially if some
information contained with initial seems important.
References
- https://hovav.net/ucsd/dist/blackhat08.pdf
- https://trustfoundry.net/basic-rop-techniques-and-tricks/
- http://qcd.phys.cmu.edu/QCDcluster/intel/vtune/reference/vc246.htm
- https://github.com/SPRITZ-Research-Group/ctf-writeups/tree/master/0x00ctf-2017/pwn/left-250
Executing arbitrary shellcode
At this point, we've covered how to use ROP to call a libc function, how to
chain together multiple ROP gadgets to call libc functions in succession,
and how to create ROP chains that execute syscalls directly. What if we
wanted to execute code that wasn't already present in memory?
Remember, the NX/DEP/W^X protection mechanisms were created to combat code
injection techniques that usually executed code directly from the stack.
If we debug any normal program today with gdb enhancements like GEF,
PEDA, or pwndbg, we can inspect the process's virtual memory mapping with
vmmap and see the permissions for each page of memory. Notice that no pages
simultaneously have write and execute permissions. The W^X protection
mechanism tries to delineate between what can be considered "code" and what
can be considered "data", but we see how well that works out when ROP is
introduced.
How do we modify these permissions so that we can execute shellcode?
We do what the operating system does when it sets permissions for the pages of
our process. If we inspect any program with strace we'll find that the
operating system makes multiple calls to the functions mmap() and
mprotect(). These two functions are used to map files or devices into memory
and to set protections on regions of memory within a process. Now that we fully
understand how to chain successive libc function calls, we can create a ROP
chain that uses mprotect() to modify the permissions of a known location
within memory. [1] In order to execute our shellcode, we would
need to follow these steps:
- Place our shellcode into some known, writeable location within memory.
- Make a call to
mprotect()to change the permissions of the page where our shellcode resides tor-xp.rstands forreadxstands forexecutepstands forprivate
- Return to the location in memory containing our shellcode and begin execution.
Here's an example of how we would do this in x86-64 using ROP. Assume that
the attacker has used an information leak to expose sensitive information
allowing them to discover the base of libc in memory:
shellcode = asm(shellcode)          # assemble our shellcode

payload = [
    pop_rdi_pop_rsi_pop_rdx_ret,    # rdi=stdin; rsi=initial, rdx=num_bytes
    0,                              # fd 0 (stdin)
    initial,                        # libc initial data structure
    len(shellcode),                 # length of assembled shellcode
    read_sym,                       # read shellcode into initial from stdin
    pop_rdi_pop_rsi_pop_rdx_ret,    # rdi=initial, rsi=page_size, rdx=perms
    initial,                        # initial now contains our shellcode
    4096,                           # assume page size is 0x1000
    5,                              # PROT_READ|PROT_EXEC
    mprotect_sym,                   # change permissions of initial
    initial                         # ret into our shellcode
]

io.sendline(flat(payload))          # flat() ensures 8 byte alignment
io.send(shellcode)                  # write shellcode into initial with stdin
What's happening here?
First, we assemble our shellcode - let's assume it's a simple
sys_execve('/bin/sh', NULL, NULL) command. Then we construct a ROP chain
that will execute read(STDIN, initial, len(shellcode)),
mprotect(initial, 4096, PROT_READ|PROT_EXEC) [2], and then
ret into our shellcode in initial. Finally, we send the ROP chain to the
target and then send the shellcode which will be read() into initial via
stdin.
Once the read() operation completes, mprotect() will change initial from
rw-p to r-xp, making our shellcode executable. We'll ret into initial
and begin executing our shellcode.
How would we do this with mmap?
- Create a file containing our shellcode.
open()the file to acquire a file descriptor.- Make a call to
mmap()using the new file descriptor, mapping the contents of the shellcode into memory with the permissionsPROT_READ|PROT_EXECand the flagsMAP_PRIVATE|MAP_ANON. [3] - Return to the location of the newly mapped memory containing our shellcode and begin execution.
How would we do this with mmap without creating a file?
- Make a call to
mmap()with the permissionsPROT_READ|PROT_WRITE|PROT_EXECand the flagsMAP_PRIVATE|MAP_ANONto createrwxppage(s) in memory. Use other write primitives or gadgets to write shellcode into the newly mappedrwxpmemory (via an open socket orstdin). - Return into the
rwxpmemory containing our shellcode and begin execution.
What if I don't have gadgets to retrieve the address returned from mmap?
We use mmap()'s MAP_FIXED flag in tandem with MAP_PRIVATE|MAP_ANON to
control the page-aligned address used by mmap(). Then we can hardcode this
known address for use elsewhere in our chain for our eventual jump to our
shellcode.
What constraints must we consider when attempting to change the permissions of existing memory segments with mprotect?
When using mprotect(), the location we provide for the void *addr argument
must be aligned to a page boundary. The same goes for mmap(), if the
void *addr argument provided is not page aligned, an error will occur. The
void *addr argument for mmap() can be null and this is usually the
best case - the kernel will pick a location within memory for us and the
mmap() call will return the address in rax.
What are some examples/scenarios in which a program might organically contain RWX buffers?
A simple example would be a program that has NX/DEP protection mechanisms disabled. We won't come across these types of targets too often, but there are still some devices in the wild (like IoT devices, routers, etc.) that are running programs without these exploit mitigation measures. For example, MIPS Linux didn't support a non-executable stack until around 2015, which can be considered pretty recent. [4][5]
Another example is Just-in-Time (JIT) compilation. JIT compilation can be
summed up as a program creating new executable code that wasn't part of the
original program and then running that code. [6] JIT compilation
is supported in most browser applications and sometimes the memory pages that
are created to store and execute the JIT compiled code have rwx permissions,
allowing attackers to take advantage of these memory pages to execute arbitrary
code. This type of vulnerability was present in WebKit's JavaScriptCore library
used by the Safari web browser on Apple iOS. [7]
This example from
the oob-v8 challenge in *CTF 2019 showcases the usage of WebAssembly to
create a rwx page within Google Chrome's JavaScript engine, v8. The author
demonstrates leaking the address of the rwx page using a vulnerability
discovered in d8, v8's accompanying JavaScript read-eval-print-loop (REPL)
shell, and then using the same vulnerability to write shellcode into the
discovered memory page to gain code execution.
References
- https://www.ret2rop.com/2018/08/make-stack-executable-again.html
- https://man7.org/linux/man-pages/man2/mprotect.2.html
- https://man7.org/linux/man-pages/man2/mmap.2.html
- https://lwn.net/Articles/653708/
- https://lore.kernel.org/patchwork/patch/506101/
- https://eli.thegreenplace.net/2013/11/05/how-to-jit-an-introduction
- https://info.lookout.com/rs/051-ESQ-475/images/pegasus-exploits-technical-details.pdf
- https://faraz.faith/2019-12-13-starctf-oob-v8-indepth/
Exploit mitigations
In this section, you'll find my notes on exploit mitigations and how they affect exploit development. This section includes discussions on the following topics:
- ASLR
- Data Execution Prevention (DEP)/NX
- Position Independent Executables (PIEs)
- Stack canaries
- Safe list unlinking
Address Space Layout Randomization (ASLR)
A history lesson
Before we describe what ASLR is or how it's used to prevent exploitation, we need to understand why it was created.
In 1996, a hacker by the name of Aleph One published an article in
Phrack Magazine titled, "Smashing the Stack for Fun and Profit". In this
article, Aleph One describes, in great detail, how buffer overflow
vulnerabilities can be exploited to gain arbitrary code execution. These
exploitation techniques utilized a stack buffer overflow to overwrite the saved
return pointer of a function with a stack address. When the vulnerable function
executes its final ret instruction, the process jumps into the stack and
begins to execute whatever data is residing at the provided location in the
stack - the data being the attacker's shellcode. [1]
The hacker, Solar Designer, took this a step further by introducting the
ret2libc technique. ret2libc leverages a stack buffer overflow to gain
control of a function's saved return address, however, instead of returning
into the stack, the process returns into libc's system() symbol. The
attacker crafts the stack frame so that system() interprets the string
'/bin/sh' as its first argument, hijacking the process to call
system('/bin/sh'). [2]
In order to thwart these stack buffer overflow exploitation techniques, the
PaX Team released PaX, a patch for the Linux kernel that implements the
W^X protection for memory pages and ASLR. [3] In a future
section we'll cover the concept of W^X and the non-executable stack.
So what is ASLR?
"The goal of Address Space Layout Randomization is to introduce randomness into addresses used by a given task. This will make a class of exploit techniques fail with a quantifiable probability and also allow their detection since failed attempts will most likely crash the attacked task." - The PaX Team [4]
The exploit techniques of the past relied upon the memory image of the process
being exploited to be the same for each exploit, with minor differences due
to changes in the environment. Attackers could expect that the libc
system() symbol and a '/bin/sh' string would be at static locations within
memory for each exploit. ASLR randomizes the base addresses of the heap, shared
objects, and the stack when these segments are mapped into process memory,
attempting to introduce enough entropy to prevent an attacker from successfully
brute forcing their locations. Without knowledge of the base address of libc
within a target's memory, attackers conducting the ret2libc exploit
technique have to guess the system() symbol address and the '/bin/sh'
string's address.
ASLR in action
To see ASLR for yourself, first let's turn it off. This technique works on Ubuntu 18.04 - if it doesn't seem to work for you, try looking up how your operating system implements ASLR and how you can enable/disable it. To turn off ASLR globally for all processes, execute the following command:
echo 0 | sudo tee /proc/sys/kernel/randomize_va_space
Now, lets see how this affects the mappings of our processes. Run strace on
/bin/ls and notice the results of the mmap() calls being made to setup
the process's memory mappings. Each call to mmap() ends up with the same
address each time, right? Let's re-enable ASLR on your operating system:
echo 2 | sudo tee /proc/sys/kernel/randomize_va_space
Now, run strace on /bin/ls a couple times. You should see that the
results of the mmap() calls are no longer the same each time /bin/ls is
invoked. The memory map of our /bin/ls process is being randomized each time
we execute it.
Breaking ASLR
Is it possible to brute force?
Well, it depends. In
this paper researchers
demonstrated that, with enough tries on the same memory mapping, attackers
could brute force the delta_mmap value described in [4].
Symbols in libc have static offsets, we can find these by using objdump. If
we know the usual base address of libc within process memory, we can compute
the address of our target symbol and then account for the entropy introduced by
ASLR. A condition that enabled the researchers to continuously brute force a
target to determine its delta_mmap value is that the parent process executed
fork() each time a connection was made. When a process fork()s, the child
process's memory mapping will be identical to the parent's. The researchers
could crash the child process as many times as necessary to discover the
delta_mmap value. Once they discovered the delta_mmap value, the
researchers computed the base address of libc within the target's memory,
allowing them to compute the location of any symbol in the target's libc to
build the final payload.
Other methods?
Another interesting thing to think about is the amount of entropy introduced by
a system's implementation of ASLR. If the number of bits randomized within the
virtual address space of a process is small enough, even if the process doesn't
fork() like in the example above and the mapping is different on each
invocation, we could still feasibly brute force the location of libc symbols
in memory with enough guesses.
A common method of beating ASLR is through utilizing some sort of sensitive
information leak, like a format string vulnerability. [6] If an
attacker can leak information from the process to discover the location of a
libc symbol in the process's memory, the attacker can calculate the base
of libc within the process's memory, beating ASLR. [7]
References
- http://phrack.org/issues/49/14.html
- https://seclists.org/bugtraq/1997/Aug/63
- https://pax.grsecurity.net/
- https://pax.grsecurity.net/docs/aslr.txt
- https://web.stanford.edu/~blp/papers/asrandom.pdf
- https://cs155.stanford.edu/papers/formatstring-1.2.pdf
- http://phrack.org/issues/59/9.html#article
Data Execution Prevention (DEP)/NX
In the previous section we briefly discussed the article,
"Smashing the Stack for Fun and Profit", where hacker, Aleph One,
described how to exploit stack buffer overflow vulnerabilities, executing
shellcode injected into a process's stack segment. The viability of the
techniques described in this article relied upon the fact that, at the time of
its writing, there was no delineation between code and data for the memory
segments of a process. [1] After a significant proliferation of
computer worms [2][3] using these techniques
occurred, operating system designers and engineers began to implement the W^X
memory protection policy for process memory pages in an attempt to mitigate
exploitation.
What is W^X?
W^X (write xor execute) is the idea that memory should be writeable or
executable, but not both. Enforcement of this policy creates a delineation
between code and data within process memory, code being r-x and data being
rw-. Now when an attempt is made to execute machine code in a rw- segment,
an exception is raised. [4]
What is NX?
The NX (No eXecute) bit is a hardware feature that, in conjuction with
operating system software, can be used to segregate memory pages into code
segments and data segments, enforcing the W^X memory protection policy.
[5] While most modern processor architectures support the NX
bit, earlier implementations did not support this feature - kernel patches like
PaX [6] and Exec Shield [7] were designed to
emulate NX bit functionality.
What is DEP?
DEP (Data Exeuction Prevention) is Microsoft's implementation of the NX
functionality on Windows operating systems. [8] Windows also
implements a software DEP feature that avoids the use of the NX bit called
SafeSEH (Safe Structured Exception Handling). [9] If a process
raises an exception, SafeSEH enforces an integrity check of the stored
exception handler, checking the exception handler against the one that was
originally present when the application was compiled. This prevents an attacker
from modifying the exception handler and intentionally raising an exeception to
hijack control of the process.
Breaking W^X
As mentioned in the previous section, Solar Designer published
the article, "Getting around the non-executable stack, (and fix)", detailing
how to conduct a ret2libc attack. The attack involves conducting a stack
buffer overflow to hijack the control flow of the process, however, instead of
jumping into the stack to execute shellcode, the attacker returns into libc's
system() symbol. This method defeats the W^X memory protection policy
because control flow is redirected to a segment of memory that is r-x. An
exception will not be rasied when the instructions of libc's system()
are executed. [10]
Return oriented programming takes
this a step further. Utilizing the stack pointer as an artificial program
counter, an attacker places words on the stack that point to valid instruction
sequences within process memory (ROP gadgets). ROP gadgets reside within a
section of memory that is labeled as code (r-x) - usually in libc. A
sufficient number of ROP gadgets provides Turing complete functionality for an
attacker, allowing them to compute anything necessary to exploit a vulnerable
application.
Another surface presenting a method to bypass W^X is Just-In-Time (JIT)
compilation. JIT compilation involves compiling code at runtime before
executing it, usually supported by applications like browsers in order to
implement things like JavaScript engines. Sometimes, the memory pages created
by browsers to store and execute JIT compiled code don't enforce the W^X
memory protection policy. This has been used by attackers to execute a
technique known as JIT spraying. JIT spraying involves the injection of
malicious code into rwx pages of an application that supports JIT
compilation. With a viable method to hijack the control flow of the
application and a sensitive information leak, the attacker returns into the
sprayed memory page to gain arbitrary code execution. [11]
References
- http://phrack.org/issues/49/14.html
- https://en.wikipedia.org/wiki/Sasser_(computer_worm)
- https://en.wikipedia.org/wiki/Blaster_(computer_worm)
- https://en.wikipedia.org/wiki/W%5EX
- https://en.wikipedia.org/wiki/NX_bit
- https://pax.grsecurity.net/docs/segmexec.txt
- https://lwn.net/Articles/31032/
- https://docs.microsoft.com/en-us/windows/win32/memory/data-execution-prevention
- https://docs.microsoft.com/en-us/cpp/build/reference/safeseh-image-has-safe-exception-handlers?view=vs-2019
- https://seclists.org/bugtraq/1997/Aug/63
- http://www.semantiscope.com/research/BHDC2010/BHDC-2010-Slides-v2.pdf
Position Independent Executables (PIEs)
Position independent code (PIC) is a term used to describe machine code that executes properly regardless of its absolute address when loaded into memory. Historically, code was position-dependent and the base address of the code needed to be loaded into the same location in memory in order to execute correctly. This is due to absolute addressing - some instructions were referencing absolute locations in memory for load and store instructions, etc. If position-dependent code were to be loaded into some different base address than what's expected by the programmer, the program would not execute correctly because instructions using absolute addressing would not be accessing appropriate values.
In contrast, position independent code uses relative addressing - references to
locations in memory utilize some offset and the operands of instructions using
relative addressing are calculated at runtime. The x86 and x86-64
architectures tackle the issue of resolving absolute addresses at runtime using
two different methods:
x86uses a fake function call in order to obtain a return address from the stack. This function usually looks like this in a debugger:__x86.get_pc_thunk.bx
The position of the code is loaded into the ebx register and instructions
using relative addressing utilize this value in order to acquire the absolute
address of their operand in memory. [1]
- Instructions in
x86-64are able to acquire the absolute address of their operands by using the value of theRIPregister with some offset. This is definitely more efficient than a fake function call.
Why do we need position independent code?
Position independent code enables our use of shared libraries. Shared library code can be loaded into any location within process memory and, because it's position independent, it will execute correctly. This also allows a process to load multiple shared libraries into memory without having to worry about address space collisions. [2] p. 1-3
How are symbols resolved for a shared library?
A shared library's exported symbols will be in different locations each time it is loaded into process memory. Fortunately for us, we have the Global Offset Table (GOT) mechanism to help us resolve the absolute address of the symbols at runtime. [3] When an object file is loaded into process memory, the dynamic linker processes the relocation entries of the file, determines the associated symbol values for the relocation entries, and then calculates the absolute addresses of the symbols. The dynamic linker then sets the GOT entries to the correct values for the symbols.
When an executable file makes a function call to a function exported by a shared library, the procedure linkage table will handle the function call and the dynamic linker will resolve the absolute address of the requested function. The dynamic linker then stores the absolute address of the function call in the executable's GOT, and execution is redirected using the absolute address that was resolved and stored in the executable's GOT. [4]
Exposition on the Procedure Linkage Table (PLT)
While the Global Offset Table handles position-independent address calculations to absolute locations, the PLT handles position-independent function calls to absolute locations. The linker is unable to resolve execution transfers (function calls) of position-independent code from one executable to another, or to a shared object, so it leverages this responsibility onto the program using the program's PLT.
The structure of the PLT is as follows:
- The special first entry of the PLT - contains code to call the dynamic linker for symbol resolution, providing the linker with the offset into the symbol table and the address of a structure that identifies the location of the caller.
- The succeeding structures in the PLT are used to handle function calls into
shared objects.
- The first address in each structure contains a
JUMPinstruction into the GOT entry for the symbol. - If the absolute address of the symbol is not resolved in the GOT, program
execution returns back to this second entry in the
symbol@PLTstructure. This entry thenPUSHes the ID of the symbol to be resolved to the stack. IDs for each symbol can be found in the_DYNAMICsection of the program. - This entry
JUMPs into the first, special entry of the PLT - the call to the dynamic linker. The dynamic linker will use the ID previouslyPUSHed to the stack and attempt to resolve the desired symbol in the shared object. If the dynamic linker is able to resolve the absolute address of the symbol in the shared object, it stores the address in the GOT and then transfers execution to the function in the shared object. All future references to thissymbol@PLTwill immediatelyJUMPto the resolved address in the GOT.
- The first address in each structure contains a
The steps described above only occur if the program is leveraging "lazy linking",
or Partial RELRO. When Full RELRO is enabled, all external symbols in the
_DYNAMIC section are resolved to their absolute addresses in each shared object
and marked r-x by the loader prior to program execution. [4]
So then, what's a position independent executable?
Position independent executables (PIEs) are executable files made entirely from position independent code. How this affects security and performance will be covered in the next section.
References
- https://stackoverflow.com/questions/6679846/what-is-i686-get-pc-thunk-bx-why-do-we-need-this-call
- ftp://bitsavers.informatik.uni-stuttgart.de/pdf/intel/iRMX/iRMX_86_Rev_6_Mar_1984/146196_Burst/iRMX_86_Application_Loader_Reference_Manual.pdf
- https://wiki.gentoo.org/wiki/Hardened/Position_Independent_Code_internals
- https://refspecs.linuxfoundation.org/ELF/zSeries/lzsabi0_zSeries/x2251.html
Exploiting PIEs
In previous sections we discussed how ASLR affects exploitation and what requirements must be met by an attacker in order to break the randomization of a target's addresses in memory. The requirements and methods in order to effectively exploit PIEs are quite similar.
What's available to an attacker when the target is not a PIE?
When an executable file is not position independent, the sections can all be
statically-addressed. A non-PIE ELF binary will be loaded into the same base
address in virtual memory each time it is executed. This behavior can be seen
with any non-PIE binary by using the size command:
size --format=sysv <non-PIE binary>
This command will display the sections of the non-PIE binary and the starting address for each section. Each section will have a static address. [1]
Why is this significant for an attacker? The attacker will always know where important resources are in the executable file, these resources can include:
- The
.gotand.got.pltsections - useful for gaining control of the program counter if a write primitive is available. - The
.dataand.bsssections - useful for reading and writing data / conducting stack pivots, etc.
With knowledge of these static addresses, an attacker can use the non-PIE
behavior of the ELF binary to construct ROP chains using the code available -
everything is statically-addressed so the gadgets will always be in the same
location. Contrast this with how attackers must utilize sensitive information
leaks in order to overcome ASLR to determine the locations of their ROP gadgets
within shared objects such as glibc.
So do PIEs break ROP?
Again, the methods to overcome PIEs and ASLR are similar. When a binary ELF is
position independent, all of the sections will be dynamically-addressed. The
sections of the ELF will start with some offset - this can be seen by using
the same size command specified above on a PIE ELF binary. [1]
A PIE ELF binary will be loaded into a different base address in virtual memory each time it is executed. This behavior increases the difficulty for an attacker to utilize the resources identified earlier, and it also removes the attacker's ability to use statically-addressed ROP gadgets.
Similiar to how an attacker must overcome ASLR in order to generate a ROP
chain, a sensitive information leak must be conducted in order to determine the
base address of the ELF in virtual memory. This can be done by leaking a return
address from the stack, a pointer to some location in .data, and so on.
Are there primitives other than an information leak that can be used to defeat PIE? How might the related vulnerabilities manifest themselves?
Yes, the previous discussion on how to defeat PIE was mostly concerned with how an attacker could generate a ROP chain, but there are other solutions that aren't stack based.
Some conditions could exist in which the attacker could use a heap based vulnerability to gain code execution, these include:
A good example of gaining code execution without needing an information leak
to determine the base address of the binary is 0CTF's BabyHeap2017 challenge.
[5] For this challenge, the attacker conducts a fastbin attack
to leak a libc address - in this case an address from the main_arena
structure in libc. After using this libc information leak to defeat ASLR,
the attacker uses the same fastbin attack to conduct a write to libc's
__malloc_hook function pointer, overwriting it with a one_gadget. The next
time malloc is called by the program, the attacker gains code execution.
Another example provided by reference [3] discusses how a Use After Free vulnerability could be used to overwrite function pointers that may be scattered in the heap. An attacker could overwrite the function pointer with an address to shellcode, achieving arbitrary code execution.
References
- https://access.redhat.com/blogs/766093/posts/1975793
- https://cwe.mitre.org/data/definitions/123.html
- https://cwe.mitre.org/data/definitions/416.html
- https://cwe.mitre.org/data/definitions/415.html
- https://uaf.io/exploitation/2017/03/19/0ctf-Quals-2017-BabyHeap2017.html
Stack canaries
Stack canaries or stack cookies are values that are placed onto the stack to monitor and protect sensitive information, such as the frame pointer or a function's return address, from buffer overflows or stack smashing. Stack canaries are usually placed between buffers and control data on the stack. The terminology for stack canaries is derived from the historic practice of using canaries in coal mines. Canaries would be affected by toxic gases much earlier than the miners, providing a biological warning system.
Stack canary implementations
Multiple stack canary implementations exist, starting from their inception in the early 2000's. Stack canaries were created because buffer overflow exploits were very popular at the time. They are one of the many different protection mechanisms that were created in an attempt to thrwart the exploitation of this vulnerability class. I'm only going to cover the most prominent examples.
StackGuard
StackGuard was a modification for GCC, adding new code to function prologues
and epilogues. StackGuard pushes a terminator canary onto the stack and
checks the value of the terminator canary before conducting the final ret of
the function.
A terminator canary is a canary that contains characters usually used to
terminate strings or input from functions like gets(), these characters
being: 0x000aff0d. The thought process behind StackGuard and terminator
canaries is that the attacker will be unable to overwrite the return address
on the stack to gain control of the EIP/RIP if their payload must include
these bad characters - the input to overwrite the return address will be
terminated too early.
If the attacker somehow manages to mangle StackGuard's terminator canary, the
canary check will fail at the function epilogue and the program will jump to
__canary_death_handler, exiting execution. [1]
Bypassing StackGuard
Referencing this Phrack article,
StackGuard may protect the return address of the function on the stack, however
, it neglects to protect the local variables from overwriting each other.
In the example, two strcpy() operations are conducted with one use of
strcpy() being vulnerable to an out-of-bounds write. Using this out-of-bounds
write, the attacker implements an arbitrary write primitive to overwrite the
return pointer. This probably wouldn't work with ASLR enabled, so a secondary
option would probably include overwriting some function pointer in the
.plt.got section to gain code execution - this is only useful if the binary
executable is not a PIE.
Another issue with StackGuard is that it does not protect the frame pointer on the stack, allowing an attacker the ability to conduct a stack pivot. [1]
Stack Smashing Protector
Stack Smashing Protector (SSP) is a GCC compiler feature that detects stack
buffer overflows and aborts if the secret value (canary) on the stack is
changed. The stack canary used by SSP is randomly generated using
/dev/urandom, and the canary is a different value each time the program is
invoked.
The SSP is pretty easy to notice when disassembling a program. At the beginning
of each function prologue, the stack canary is acquired from thread local
storage and pushed onto the stack after the frame pointer. At the end of the
function epilogue, prior to calling leave or ret, the value of the canary
is fetched from the stack and compared against the value saved in thread local
storage with an XOR operation. If the outcome of this XOR operation is not
0, we have failed the canary check and the __stack_chk_fail function is
called, exiting program execution. [3]
Bypassing SSP
There are multiple methods to bypass SSP, but some conditions must exist. Some crowd favorites are:
- Using a format string vulnerability to conduct a sensitive information leak in order to leak the value of the canary. [5]
- Using an arbitrary write primitive to overwrite the value of
__stack_chk_failin the global offset table and then intentionally failing the canary check in order to gain code execution. [6] - If a server process uses
fork()to handle multiple connections, attackers can brute force the value of the canary because the value of the canary will not change for child processes. [4]
References
- https://www.coresecurity.com/sites/default/files/private-files/publications/2016/05/StackguardPaper.pdf
- http://phrack.org/issues/56/5.html
- https://wiki.osdev.org/Stack_Smashing_Protector
- https://ctf101.org/binary-exploitation/stack-canaries/
- https://spotless.tech/angstrom-ctf-2020-Canary.html
- https://dunsp4rce.github.io/redpwn-2020/pwn/2020/06/26/dead-canary.html
Safe list unlinking
History
Before we talk about safe list unlinking, let's discuss unsafe list unlinking.
In 2001, Michel "MaXX" Kaempf wrote the Phrack Article "Vudo malloc tricks" [1]. In this article, he describes multiple different techniques for corruption and exploitation of the heap. For this discussion, we're interested in topic 3.6.1 - The unlink() technique.
Gaining arbitrary code execution using the unlink() technique was first
introduced by "Solar Designer". The technique tricks dlmalloc into processing
carefully crafted forward, fd, and backward, bk, pointers of a chunk being
unlink()ed from a doubly linked list. Abusing the unlink() macro in this
manner provides an attacker the ability to conduct an arbitrary write to any
location in memory which can lead to arbitrary code execution. The unlink()
macro is as follows:
#define unlink( P, BK, FD ) {   \
    BK = P->bk;                 \
    FD = P->fd;                 \
    FD->bk = BK;                \
    BK->fd = FD;                \
}
The proof of concept provided in this article leverages a heap buffer overflow
to overwrite the chunk metadata of a succeeding chunk, clearing the
PREV_INUSE bit and tricking malloc into thinking that the overflown chunk
is currently free. When the corrupted chunk is free()d, malloc
consolidates the two chunks, executing the unlink() macro on the overflown
chunk - triggering a reflective write. Because the attacker controls the user
data of the overflown chunk, the attacker can craft the fd and bk pointers.
In this example, the fd pointer is the address of an imaginary chunk that
overlaps with the __free_hook, and the bk pointer is the address of an
imaginary chunk that overlaps the shellcode.
At the time this article was written, W^X mitigations for memory segments were
uncommon. The proof of concept stores sys_execve("/bin/sh", NULL, NULL)
shellcode on the heap, uses the arbitrary write to write the heap address of
the shellcode to the __free_hook, and then executes free() to gain code
execution. The shellcode accounts for the reflective write conducted by
unlink() at the fd of the imaginary chunk that overlaps the shellcode. The
shellcode executes a jmp to avoid executing the invalid instructions
represented by the fd pointer.
Safe unlinking
The unlink() technique was used to exploit a number of vulnerable
applications and, surprisingly, it took a while before a fix was implemented
for glibc. It wasn't until glibc 2.3.4, released in 2004, that checks were
implemented for the fd and bk pointers of chunks being operated upon by
unlink(). The updated unlink() macro can be found below [2]:
#define unlink( P, BK, FD ) {                                               \
    BK = P->bk;                                                             \
    FD = P->fd;                                                             \
    if (__builtin_expect (FD->bk != P || BK->fd != P, 0))                   \
        malloc_printerr (check_action, "corrupted double-linked list", P);  \
    else {                                                                  \
        FD->bk = BK;                                                        \
        BK->fd = FD;                                                        \
    }                                                                       \
}
In the updated unlink() macro, a check is now conducted to ensure that the
bk of the fd chunk pointed to by the chunk being inspected, P, is P. A
check is also conducted to ensure that the fd of the bk chunk pointed to by
the chunk being inspected, P, is P. This prevents an attacker from setting
the fd and bk of P to arbitrary locations in memory, thwarting the
previous technique's method of using imaginary chunks for arbitary writes. If
the program fails this check, the process raises the SIGABRT signal and
terminates execution.
This mitigation has been proven to still be exploitable, it just requires
specific circumstances to be feasible. A good example of a situation in which
an attacker could still exploit this technique is if a pointer to the overflown
chunk is present in some location in memory that the attacker can control, such
as .data or .bss. The attacker can then craft the fd and bk pointers
of the overflown chunk to point to imaginary chunks that overlap the portion
of .data containing the heap pointer of the overflown chunk. This technique
spoofs valid fd and bk chunks that will pass the updated unlink()
check. If the program uses this location in .data to track heap chunk
addresses for management and editing of data, the attacker can abuse this
technique to corrupt pointers in .data, eventually creating an arbitrary
write primitive.
Later mitigations
As more techniques for exploiting unlink() were discovered, more patches were
released for glibc to mitigate exploitation of this mechanism. A good example
is the below code that was implemented for the unlink_chunk() function in
malloc. This code checks that the next chunk's prev_size field matches the
current chunk's size field:
static void
unlink_chunk (mstate av, mchunkptr p)
{
  if (chunksize (p) != prev_size (next_chunk (p)))
    malloc_printerr ("corrupted size vs. prev_size");

<...snip...>
Patches continue to be released that work to harden glibc's implementation of
malloc, the most recent patch being in 2019.