This lesson covers more in-depth manipulation of stock data in .csv files with
pandas. In this lesson, we create empty dataframes with pandas and
selectively include data from a number of .csv files of different stock
symbols. This lesson provides examples of selecting stock information based upon
date ranges from various stock symbols, and provides guidance on how to avoid
ingesting invalid (NaN values) into the dataframe. An example provided by the
lesson can be found here.
Inner join vs outer join
An inner join of a table provides the common items between the two tables being joined. An example Venn-diagram of the operation is provided below:

An outer join of a table provides the common items between two tables, as well, however it also provides the left or right quantities of the two tables being joined. An example Venn-diagram of a left outer join and a right outer join are provided below:
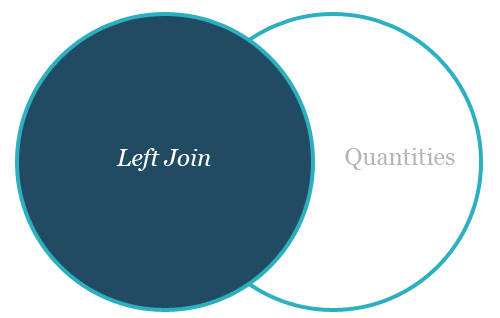

The default method of join for a pandas dataframe is the left outer join.
Normalizing price data
The preferred method to normalize data within a pandas dataframe is to conduct
the following operation in Python:
my_dataframe = my_dataframe / mydataframe.ix[0, :]Quizzes
How many days were U.S. stocks traded at NYSE in 2014?
- 365
- 260
- 252